University of Southampton Falmouth Field Course 2013 26th June -
26th June 2013 -
Falmouth Tides (UTC): HW 07:20 5.1m
LW 13:50 0.3m
Cloud
cover: 100% -
Sea State: Flat -
Air Temperature: 14.9°C
Offshore Methods
Niskin Bottle Samples
At each station Niskin bottles were fired to enable water samples at different depths to be analysed. The samples were collected from the bottles on the CTD rosette and transferred to appropriately labelled bottles for use in the wet lab onboard RV Callista. A separate oxygen sample was collected from the Niskin bottle with care being taken that no trapped air entered the sample. In the lab 1ml each of Manganous Chloride and Iodide solution were added to the oxygen sample. A phytoplankton sample was prepared by transferring seawater to a sample bottle containing Iodine. In order to prepare a nitrate and phosphate sample, 5ml of seawater from the Niskin bottle at each depth was filtered into a glass sample bottle and labelled for analysis in the lab. The filter paper was placed in acetone in the fridge and kept for chlorophyll analysis. The same process was followed in order to obtain a silicon sample which was stored in a plastic bottle with the filter paper again being used for chlorophyll analysis.
Zooplankton Samples
A weighted net was deployed and travelled vertically through the water column under the assumption that no zooplankton would will enter the net. The net was then lifted through the required water depth and closed on ascent using an acoustic messenger. The zooplankton were fixed using formalin.
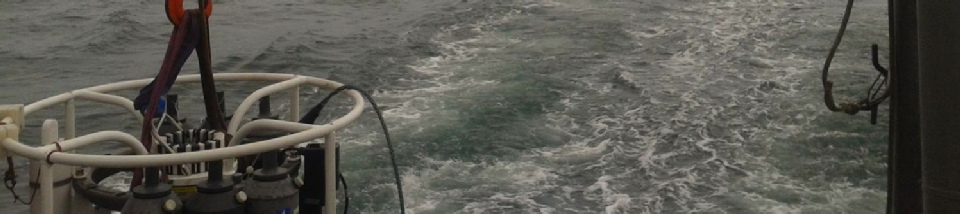
CTD
A CTD rosette was deployed with Niskin bottles, flurometer, transmissometer and a light sensor using a winching system at the back of RV Callista. Niskin bottles were fired from an onboard computer system which also recorded a live feed of temperature, salinity, density, chlorophyll and light attenuation data.
ADCP
The Acoustic Doplar Current Profiler (ADCP) attached to the hull of RV Callista gave recordings of current velocity, backscatter and current direction.
Laboratory Methods
Biological Methods
Zooplankton counts
Zooplankton sample bottles, reduced from 1L to 500ml, from different
stations and depths were analysed for zooplankton groups/orders. 10ml samples were
collected from sample bottles for analysis in Bogorov counting chambers. Using a
light microscope and a ‘Coastal Plankton Photo Guide for European Seas – Dr Pfeil’
for reference, zooplankton were identified. Phytoplankton, such as diatoms, were
also observed. The individual counts of these groups were tallied in tables, giving
the number of zooplankton in a 10ml sample.
Phytoplankton counts
Samples, once reduced, labelled, concentrated to 10ml, and pre-
Chemistry Methods
Phosphate
Method: Parsons T. R. Maita Y. and Lalli C. (1984) A manual of chemical
and biological methods for seawater analysis p.173 Pergamon.
Notes: Samples were
left for 1 hour and 30 minutes, rather than the 1 one hour recommended.
Silicate
Method: Parsons T. R. Maita Y. and Lalli C. (1984) “ A manual of chemical
and biological methods for seawater analysis” 173 p. Pergamon.
Notes: Blank and standards
used from morning session.
Oxygen
Method: Grasshoff, K., K. Kremling, and M. Ehrhardt. (1999). Methods of seawater
analysis. 3rd ed Wiley-
Chlorophyll
Method: Parsons T. R. Maita Y. and Lalli C. (1984) “A manual of chemical
and biological methods for seawater analysis” 173 p. Pergamon.
Notes: N/A
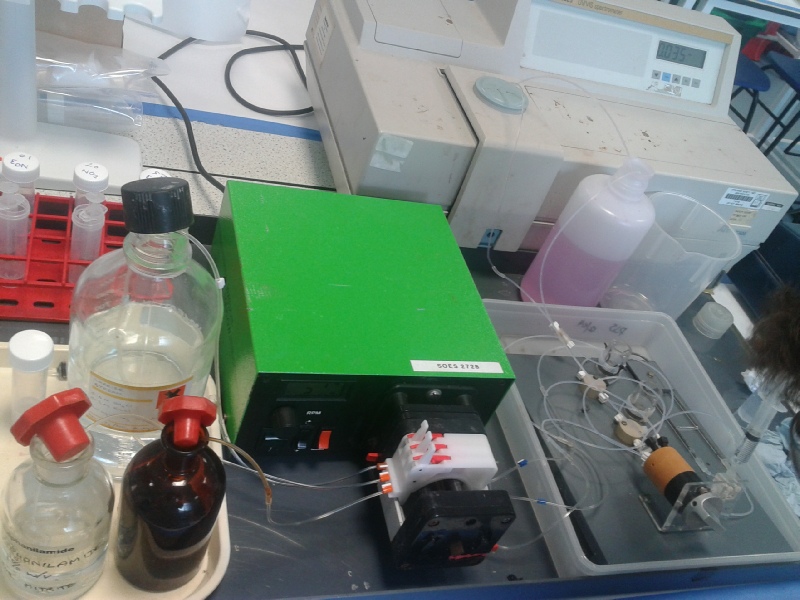
Nitrate (figure O.2)
Method: Johnson K. and Petty R.L.(1983) “Determination of nitrate
and nitrite in seawater by flow injection analysis”. Limnology and Oceanography
28 1260-
Notes: Values converted to volts to give a graphical reading, some
graphical readings were incorrect due to air bubbles in spectrometer, one duplicate
was lost due to this.
Figure O.2: Nitrate concentration tested using flow injection
References:
Grasshoff, K., Kremling, K., Ehrhardt, M., (1999). Methods of seawater analysis.
3rd ed. Wiley-
Johnson, K., Petty, R. L., (1983). Determination of nitrate and nitrite in seawater
by flow injection analysis. Limnology and Oceanography 28 1260-
Parsons, T. R., Maita, Y., Lalli, C., (1984). A manual of chemical and biological methods for seawater analysis. Pergamon. 173
Offshore
| Introduction |
| Methods |
| Results |
| Discussion |
| Physical |
| Chemical |
| Biological |
| Physical |
| Chemical |
| Biological |
| Introduction |
| Methods |
| Results |
| Discussion |
| Physical |
| Chemical |
| Biology |
| Physical |
| Chemical |
| Biology |