University of Southampton Falmouth Field Course 2013 26th June -
4th July 2013 – Estuary Sampling
Falmouth Tides (UTC): HW 02:09 4.20m
LW 09:31 1.50m
HW 15:39 4.30m
LW 22.03 1.5m
Physical Results
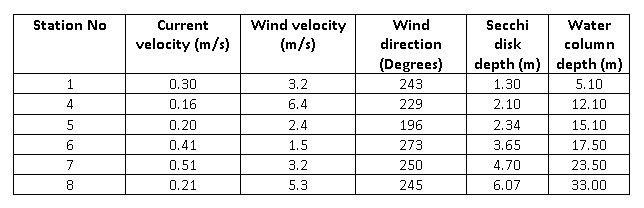
Vertical temperature (°C), salinity, fluorescence (µg/L) and transmission (v) are presented, as well as ADCP across estuary current velocities (m/s) profiles at five stations only (Stations1, 4, 5, 6, 7 and 8) are presented, as CTD and ADCP data was not collected at all eight stations. Wind velocity (m/s) and direction (Degrees) readings were taken from onboard navigation system.
Current velocities, wind velocities and direction
Wind direction during sampling at all sations were predominantly southwesterly (table 1). Wind velocities ranged from 1.5 m/s at Station 6, where section of the estuary was sheltered, while highest recorded wind velocity of 6.4 m/s at Station 4 could be due to wind convergence and thus producing funneling effect.
Table EP.1
Temperature
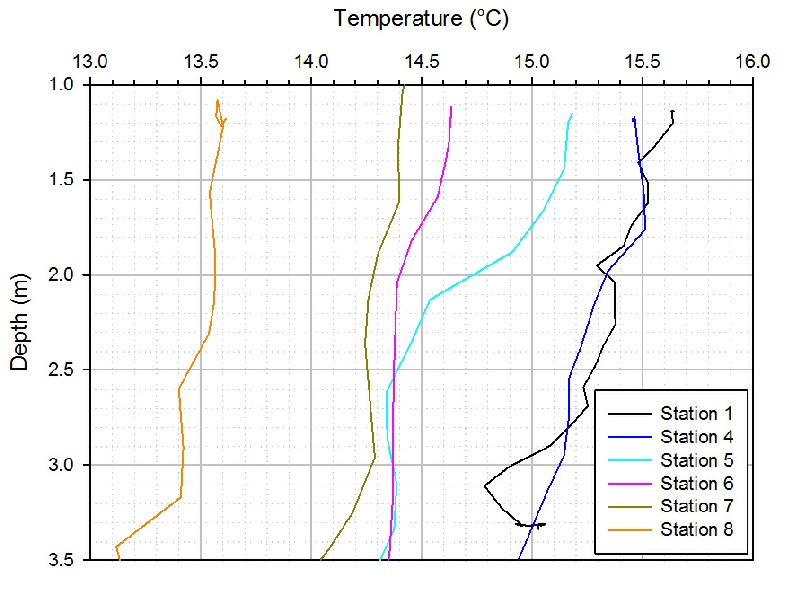
Temperature at all stations (figure EP.1) decreases with depth. Vertical variations in temperature are greatest at Station 5 from 15.7°C at subsurface to 14.9°C at 3.5 m depth. The thermocline at Station 5 is most pronounced and confined between depths of 1.5 to 2.6 m depth. Upper water column (1.5 m) temperature values of 15.7°C, 15.4°C and 15.2°C at Stations 1, 4 and 5 respectively are higher than temperature values of 14.6°C, 14.4°C and 13.6°C observed at Stations 6, 7 and 8.
Figure EP.1: CTD derived vertical temperature profiles at all stations
Salinity
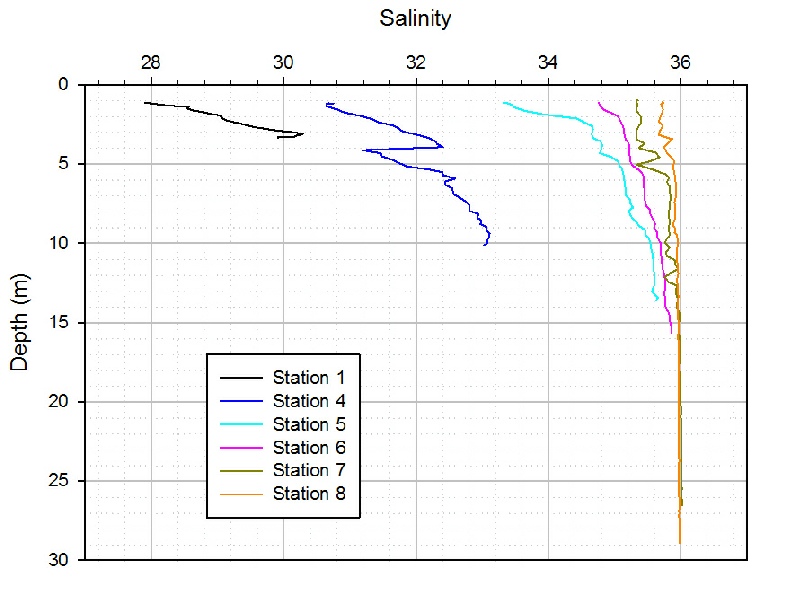
Salinity at all stations incerases with depth, with lowest surface salinities of 28 observed at Station 1 (figure EP. 2), which is to be expected, as Station 1 is in close proximity to river Fal, i.e. fresh water input, clearly seen in along transect salinity time series (figure EP. 3), where surface salinity drops to 22.30. Variations in salinities with depth are greatest at Stations 1, 4 and 5 and the haloclines exibit lateral character, while vertical salinity variations at Stations 6, 7 and 8 decrease as the water column gets well mixed. Vertical variations with depth at Station 1, 4 and 5 range from 28.00 to 30.10, 30.15 to 32.25 and 32.30 to 34.40 respectively.
Figure EP.2: CTD derived vertical salinity profiles at all stations
Figure EP.3: Time series of salinity, temperature and water depth during sampling period taken from the head of the estuary towards the mouth of the estuary
Fluorescence
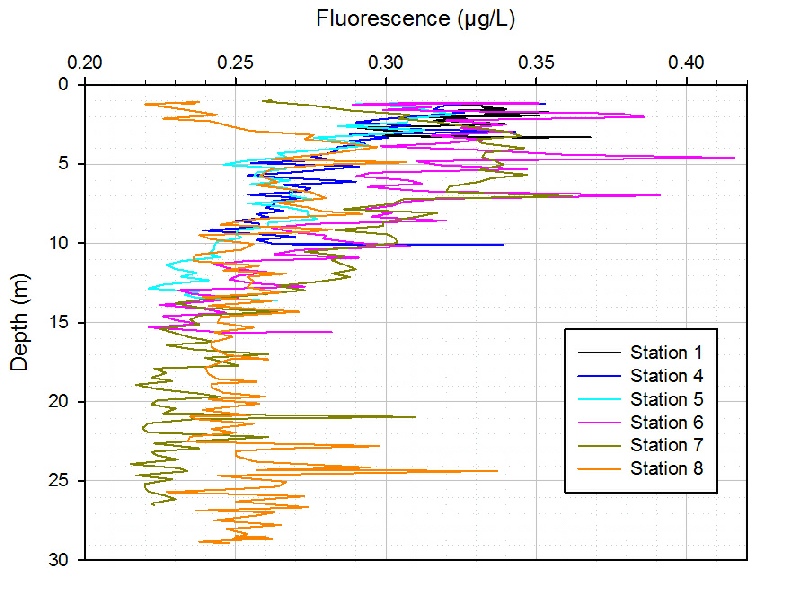
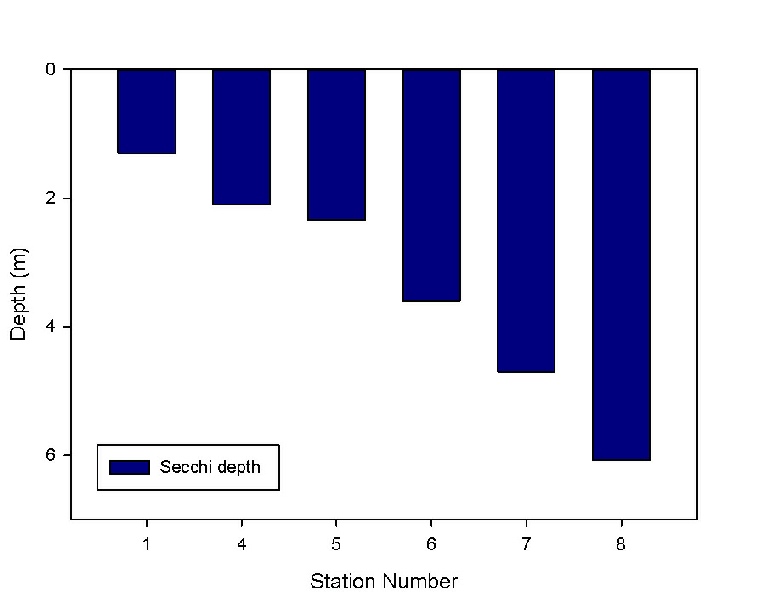
Subsurface fluorescence values at all stations range from 0.22 µg/L (Station 8) to 0.42 µg/L (Station 6). Peaks of fluorescence at all stations correspond approximately to bottom of the photic zone, calculated using secchi disk depths (1% light penetration equals three times secchi disk depth) (table 1, figure EP. 5).
Figure EP.4: CTD derived vertical fluorescence profiles at all stations
Figure EP.5: Secchi disk depth at all stations
Transmission
Transmission readings represent the amount of suspended particulate matter within the water column. Highest transmission readings are observed at Station 8 (4.22 v), where water column depth is larger (table EP.1), while at Stations 1 the average transmission reading is 3.82 v and Station 4 the average reading is 4.3 v.
Figure EP.6: CTD derived vertical transmission profiles at all stations
Current velocity changes along sampled area
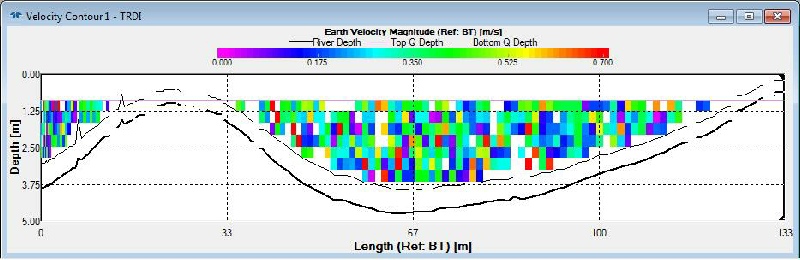
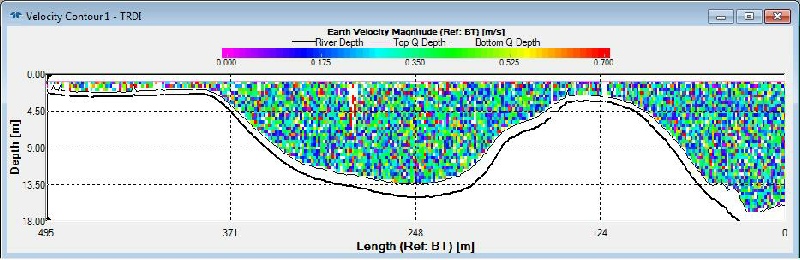
Mean current velocity at Station 1 is 0.30 m/s (table EP.1), however, it is highly variable across the transect of the profile (figure EP. 3). This would be due to shear between the water column and the seabed, creating turbulence. Turbulence within the water column is also generated by wind mixing. Red regions in ADCP current contour profile represent localised eddies and instabilities.
Figure EP.7: ADCP derived contour current velocity profile at Station 1 taken across the width of the estuary
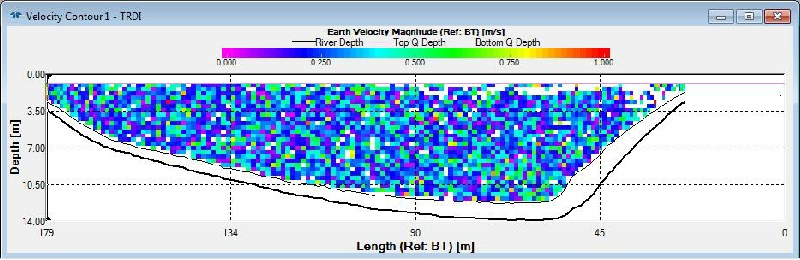
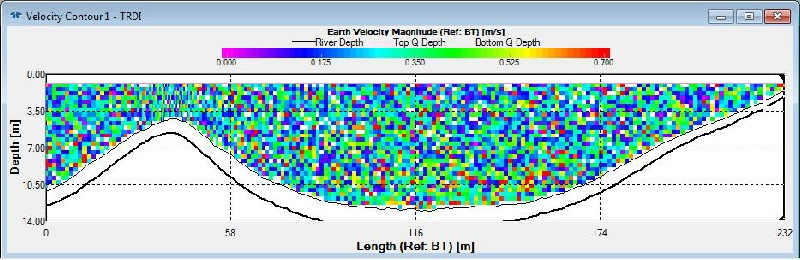
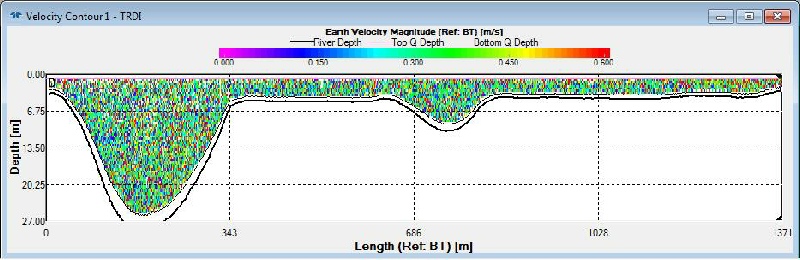
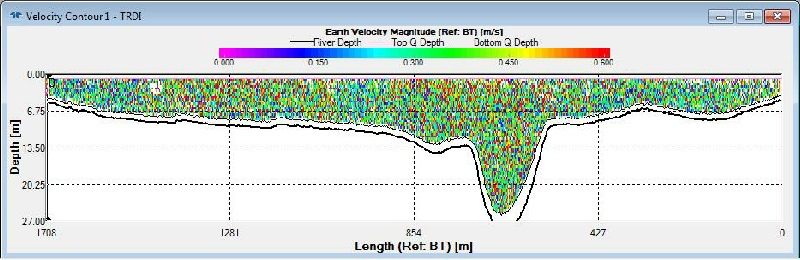
Mean current velocity at Station 4 is 0.16 m/s (table 1). The current contour profile (figure EP. 8) shows less variability of current velocity across the transect in comparison with current velocity variations at Station 5 (figure EP. 9). Variability in current velocity increases at Station 6 (figure EP. 10), where eddy presence is also evident. Current velocity profile at Station 8 (figure EP. 12) shows pockets of lower current velocities at the following transect sections: 0 to 427 m, 854 and 1281 m and 1281 and 1708 m. This could be due to flow reversal (Simpson and Sharples, 2012), where current velocities decrease to approximately 0.15 m/s. Overall, current velocities at all stations decrease towards the seabed, due to the effect of shear stress between the overlying water column and the seabed. Thus, highest turbulence is observed at or near the seabed as well as the surface, where shear stress is generated by winds.
Figure EP.8: ADCP derived contour current velocity profile at Station 4 taken across the width of the estuary
Figure EP.9: ADCP derived contour current velocity profile at Station 5 taken across the width of the estuary
Figure EP. 10 ADCP derived contour current velocity profile at Station 6 taken across the width of the estuary
Figure EP. 11 ADCP derived contour current velocity profile at Station 7 taken across the width of the estuary
Figure EP. 12 ADCP derived contour current velocity profile at Station 8 taken across the width of the estuary
References
Simpson, J. and Sharples, J. 2012, Introduction to the Physical and Biological Oceanography of Shelf Seas, , Cambridge University Press, Cambridge, UK
Estuary
.JPG)
| Introduction |
| Methods |
| Results |
| Discussion |
| Physical |
| Chemical |
| Biological |
| Physical |
| Chemical |
| Biological |
| Introduction |
| Methods |
| Results |
| Discussion |
| Physical |
| Chemical |
| Biology |
| Physical |
| Chemical |
| Biology |