University of Southampton Falmouth Field Course 2013 26th June -
26th June 2013 -
Falmouth Tides (UTC): HW 07:20 5.1m
LW 13:50 0.3m
Cloud
cover: 100% -
Sea State: Flat -
Air Temperature: 14.9°C
Physical Results
The vertical profiles of the following investigated parameters (startification index,
temperature (°C), salinity, density (kg m-
Stratification index
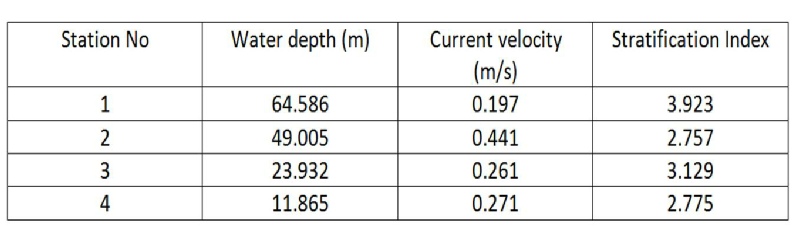
Stratification index, S, shows the stability of the water column calculated using log10(H/ c*U3),
where H = average water depth (m), U = average current velocity (m s-
As drag coefficient is usually constant for coastal waters, it has been omitted and stratification index for all stations has been taken to be equal to log10(H/U3). Water depths and current velocities have been taken from ADCP discharge summary tables.
Figure OP.1: Summary of stratification index for all stations
Temperature
Waters across the study location exhibit seasonal thermal stratification profiles (figure OP.2), with Station 1 showing the strongest vertical stratification, with a temperature range of 4°C between subsurface (14°C at approximately 2 m depth) and deep waters (10.5°C at approximately 31 m depth). Stratification strength decreases towards Station 4, where the water column is well mixed with an average temperature of 11.45°C. Station 2 also exibits a pronounced thermocline, confined between approximately 8m and 17m depth. Temperature values vary between 13.2°C (surface) and 11.1°C at depth (approximately 20 m depth). Temperature range at Station 3 is between 13.2°C (surface) and 11.9°C (approximately 18m).
Figure OP.2: CTD derived vertical temperature profiles at all stations
Salinity
Salinity varies between 35.10 and 35.27 from Station 1 to Station 4 (figure OP.3). Salinity at all stations increases with depth. At Station 1 there is a marked increase in salinity at approximately 30 m depth from 35.11 to 35.27, indicating a highly stratified water column, marking the bottom of the halocline, which is in correspondence with the thermocline seen in the vertical temperature profile at the same station (figure OP.2). At Station 2 the salinity range with depth is smaller than at Station 1 (35.12 to 35.22) and the halocline is less pronounced. The halocline gradually disappears from Station 3 to 4 where salinity range is less than 0.01.
Figure OP.3: CTD derived vertical profiles of salinity at all stations
Density
Density at all stations increases with depth (figure OP.4), which correlates to the
vertical temperature and salinity profiles (figure OP.2 & figure OP.3 respectively).
Station 1 experiences largest range in denisty with depth, with a surface denisty
of 1026.3 kg m-
Figure OP.4 :CTD derived vertical density profiles at all stations
Fluorescence
The fluorescence vertical profiles (figure OP.5) are indicative of chlorophyll a
(Chl-
Figure OP.5: CTD derived fluorescence vertical profiles at all stations
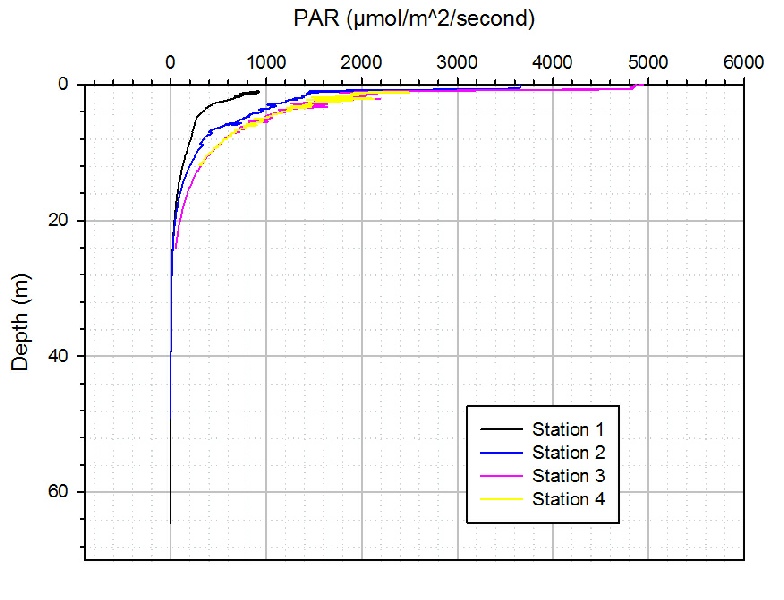
Photosynthetic active radiation (PAR)
Solar radiation penetration and thus photosynthetic active radiation (PAR) is highly variable depending on the characteristics of water body, but generally it is expected to be higher in the upper part of the water column and to decrease exponentially with depth, which can be seen clearly in figure OP.6. Scattering diffuses downward irradiance flux with depth, which causes an increase in attenuation with depth, which is very pronounced in turbid environments (Kirk, 2011). The bottom of the euphotic zone at ~ 30 m depth (figure OP.6) marks the top of the seasonal thermocline (figure OP.2 & figure OP.4).
Figure OP.6: CTD derived PAR attenuation with depth
Transmission
The transmission at Stations 1 remains fairly constant down to a depth of approximately 25m (at around 3.7v) where it then decreases sharply down to almost 3.6v at a depth of approximately 27m. It then increases to above 3.8v and steadily decreases with depth to 67m by less than 0.2v. In the upper part of the water column at Station 2, transmission shows a pronounced gradient between the subsurface and 18m, from 3.8v to 3.5v. There is then a slight increase of approximately 0.1v at 20m depth, where it then begins to decrease steadily with depth down to 50m (3.58v). Both Stations 3 and 4 exhibit little variability of transmission with depth, with Station 3 varying only in the top 8m of the water column by less than 0.1v.
Figure OP.7: CTD derived vertical profiles of transmission at all stations
References
Kirk, J., 2011, Light and Photosynthesis in Aquatic Ecosystems, Chapter 6.3: Downward
irradiance-
Simpson, J. and Sharples, J. 2012, Introduction to the Physical and Biological Oceanography of Shelf Seas, , Cambridge University Press, Cambridge, UK
Viljanen, M. Holopainen, A-
.JPG)
.JPG)
.JPG)
.JPG)
Offshore
| Introduction |
| Methods |
| Results |
| Discussion |
| Physical |
| Chemical |
| Biological |
| Physical |
| Chemical |
| Biological |
| Introduction |
| Methods |
| Results |
| Discussion |
| Physical |
| Chemical |
| Biology |
| Physical |
| Chemical |
| Biology |