University of Southampton Falmouth Field Course 2013 26th June -
26th June 2013 -
Falmouth Tides (UTC): HW 07:20 5.1m
LW 13:50 0.3m
Cloud
cover: 100% -
Sea State: Flat -
Air Temperature: 14.9°C
Biological Results
Zooplankton
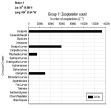
Zooplankton Station 1 (G9)
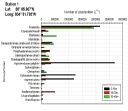
The highest total number of zooplankton (8,650,000 cells/L) was found at depths of
0-
Figure OB.1: Abundance of zooplankton groups at different depth intervals within the water column at Station 1 (G9).
Zooplankton Station 2 (G9)
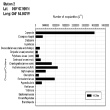
Only one zooplankton net was deployed between 10-
Figure OB.2: Abundance of zooplankton groups at different depth intervals within the water column at Station 2 (G9).
Zooplankton Station 1 (G11)
The zooplankton net was deployed between 0-
Figure OB.3: Abundance of zooplankton groups at different depth intervals within the water column at Station 1 (G11).
Phytoplankton
Phytoplankton Station 1 (G9)
As seen in figure B.4, the most abundant phytoplankton species was Chaetoceros spp. at a depth of 27m. The highest total number of phytoplankton was observed at a depth of 27m whilst the lowest total number was observed at 41m. However this value of 18,000cells/L was only 1000 cells/L less than that counted at 1.2m (19,000 cells/L).
Figure OB.4: Abundance of phytoplankton species at different depths within the water column at Station 1 (G9).
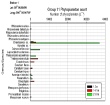
Phytoplankton Station 2 (G9)
At a single depth of 32.5m, Chaetoceros spp. showed the highest measured abundance of 26,000 cells/L. It can be noted that the only species present at all depths was Ceratium furca, with values of 2,000 cells/L, 1,000 cells/L and 1,000 cells/L at 5.8m, 16.4m and 32.5m respectively. The highest total number of phytoplankton was observed at a depth of 32.5m at a value of 34,500 cells/L.
Figure OB.5: Abundance of phytoplankton species at different depths within the water column at Station 2 (G9).
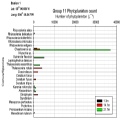
Phytoplankton Station 1 (G11)
As observed at station 2, Chaetoceros spp. was the most abundant species at a single depth (37,000 cells/L at 18m). Furthermore Chaetoceros spp. was the only species present at each depth measured with values of 1,600 cells/L, 3,000 cells/L and 37,000 cells/L at depths of 1.3m, 14.1m and 18m respectively. The highest total number of phytoplankton was observed at a depth of 18m at a value of 47,000 cells/L.
Figure OB.6: Abundance of phytoplankton species at different depths within the water column at Station 1 (G11).
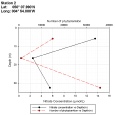
Diatoms Vs. Silicon Station 1 (G9)
As can be seen below in figure B.7, silicon concentration shows an overall increase
with depth. The concentration can be seen to drop slightly between 0 and 15m (0.78µmol/L
and 0.62µmol/L respectively), before increasing to 3.0 µmol/L at 41m. Diatom abundance
shows a similar trend to silicon concentration between 0m-
Figure OB.7: Abundance of diatoms with silicon concentration at different depths within the water column at Station 1 (G9).
Diatoms Vs. Silicon Station 2 (G9)
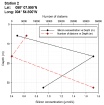
Figure B.8 shows that the number of diatoms decreases between 5.8m and 16.4m from 6,000 cells/L to 0 cells/L. The number then increases rapidly and at 32.5m the number of diatoms has reached a value of 33,000 cells/L. On the other hand, silicon concentration rises between 5.8m and 16.4m (increasing from 0.49µmol/L to 1.72µmol/L), before dropping to 0.91µmol/L at 32.5m. The two plots show opposite trends.
Figure OB.8: Abundance of diatom species with silicon concentration at different depths within the water column at Station 2 (G9).
Diatoms Vs. Silicon Station 1 (G11)
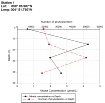
Diatom abundance can be seen to have a value of 2000 cells/L at a depth of 1.31m, before increasing to 9,000 cells/L at 14.13m. This increase is followed by a large jump to 45,000 cells/L at 21.8m. Silicon concentration shows a similar trend between 1.31m and 14.13m, where it rises from 2.09µmol/L to 2.33µmol/L. However, whereas the number of diatoms increases between 14.13m and 21.8m, the silicon concentration decreases between the same depths, falling from 2.33µmol/L to 2.22µmol/L.
Figure OB.9: Abundance of diatom species with silicon concentration at different depths within the water column at Station 1 (G11).
Phytoplankton Vs. Nitrate Station 1 (G9)
As shown in figure B.10 nitrate concentration shows an overall increase between 1.2m-
Figure OB.10: Abundance of total phytoplankton with nitrate concentration at different depths within the water column at Station 1 (G9).
Phytoplankton Vs. Nitrate Station 2 (G9)
At station 2 both nitrate concentration and numbers of phytoplankton decrease in
shallower waters (5.8m-
Figure OB.11: Abundance of total phytoplankton with nitrate concentration at different depths within the water column at Station 2 (G9).
Phytoplankton Vs. Nitrate Station 1 (G11)
As shown in figure B.12 nitrate concentration increases from 0.664µmol/L to 14.1494µmol/L
between 1.3m-
Figure OB.12: Abundance of total phytoplankton with nitrate concentration at different depths within the water column at Station 1 (G11).
Offshore




| Introduction |
| Methods |
| Results |
| Discussion |
| Physical |
| Chemical |
| Biological |
| Physical |
| Chemical |
| Biological |
| Introduction |
| Methods |
| Results |
| Discussion |
| Physical |
| Chemical |
| Biology |
| Physical |
| Chemical |
| Biology |