University of Southampton Falmouth Field Course 2013 26th June -
4th July 2013 – Estuary Sampling
Falmouth Tides (UTC): HW 02:09 4.20m
LW 09:31 1.50m
HW 15:39 4.30m
LW 22.03 1.5m
Methodology
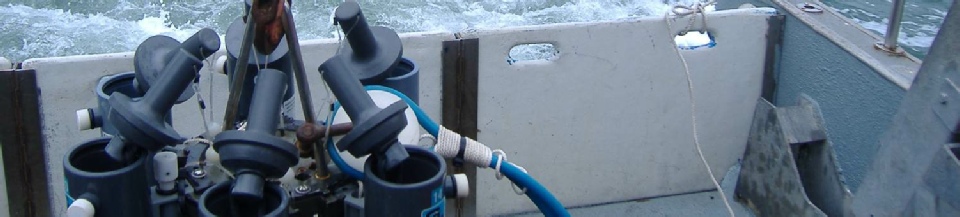
The phosphate, dissolved silicon, nitrate, dissolved oxygen and chlorophyll were all measured by deploying the CTD to different depths or using the on board pump to take a surface measurement. The phytoplankton samples were taken from the surface sample at certain sites as using the same depth allowed comparison between sites. Zooplankton measurements were taken at some sites by deploying a zooplankton net which had 100µl mesh size and was 50cm in diameter. The zooplankton net was deployed at the top of the river for 5 minutes to observe zooplankton populations in the fresher part of the estuary. Both the zooplankton and phytoplankton were not taken at every site due to storage restrictions.
Station 1
Location: 50°14.301N, 005°00.927W
Time: 08:25 UTC
Comments: Two different water depths sampled here, at 1m (surface sample) and 3.1m. Depth of the station was 5m, limiting the depths we could sample to. Chemical sampling included phosphate, dissolved silicon, nitrate, dissolved oxygen and biological measurements taken here included chlorophyll, phytoplankton and zooplankton. The phytoplankton sample was measured from the surface sample and the zooplankton was collected using a zooplankton net. The salinity and temperature were also recorded and a salinity bottle was used.
Station 2
Location: 50°13.828N, 005°00.988W
Time: 08:50 UTC
Comments: Only a surface measurement was taken at this site since it was closely positioned to station 1 and there were limitations on biological storage equipment available. Unpredictable mixing was also present at this site from fresh water eddies and fresh water pockets were observed, further persuading the group to not sample at different depths at this site. The maximum depth at this site was 5.3m.
Station 3
Location: 50°13.658N, 005°00.944W
Time: 08:55 UTC
Comments: Only a surface sample was taken at this site as we were limited by biological equipment available to us. Therefore the salinity, temperature, depth, dissolved silicon, nitrate and phosphorus were recorded. The maximum depth at this site was 9.0m. This station was a lower salinity than previous stations.
Station4
Location: 50°13.516N, 005°00.976W
Time: 09:04 UTC
Comments: 3 different depths were sampled at this station, 1m (surface sample) 5.15m and 10.4m. All measurements were taken at this station, apart from zooplankton, the net was not deployed due to lack of storage facilities but zooplankton was measured here. The maximum depth at this site was 12.0m.
Station 5
Location: 50°13.278N, 005°01.603W
Time: 09:30 UTC
Comments: 3 different depths were sampled at this site, 1m (surface sample), 4.6m
and 13.8m. When the surface bottle was fired the Niskin bottle did not close properly
so the sample was pumped from the surface rather than re-
Station 6
Location: 50°12.191N, 005°02.430W
Time: 10:03 UTC
Comments: 3 different depths were taken at this site, 1m (surface sample), 5.5m and 15.2m. The maximum depth for this site was 17.5m. The station was at Pill Creek and there are two small channels that lead into pill creek, Channels Creek and Tolearne Creek. This may have influenced the physical structure of the sampling at this site. Whilst sampling the vessel drifted a short distance due to the changing tidal state and the end position was noted at 50°12.185N, 005°02.389W. All the measurements were taken and the zooplankton net was deployed starting at 50°12.212N, 005°02.331W. A phytoplankton sample was taken and an ADCP transect was also measured near this site.
Station 7
Location: 50°10.441N, 005°01.555W
Time: 10:37 UTC
Comments: The maximum depth was 28.2m at this site and the CTD was deployed to 1m (surface sample), 5.35m and 13.9m. All the chemical measurements were taken at each depth but no biological samples were taken. An ADCP transect was also taken near this site.
Station 8
Location: 50°09.272N, 005°01.902W
Time: 11:07 UTC
Comments: The maximum depth for this site was 34.5m and the CTD was deployed at 3 different depths, 1m (surface), 6m and 28.8m. All measurements were taken at this site including phytoplankton and zooplankton measurements. A salinity bottle was taken at this site as it was closest to the mouth of the estuary so the group had a salinity bottle from station 1 at the top of the estuary and station 8 at the bottom. An ADCP transect was taken here across the whole estuary.
Estuary
| Introduction |
| Methods |
| Results |
| Discussion |
| Physical |
| Chemical |
| Biological |
| Physical |
| Chemical |
| Biological |
| Introduction |
| Methods |
| Results |
| Discussion |
| Physical |
| Chemical |
| Biology |
| Physical |
| Chemical |
| Biology |