University of Southampton Falmouth Field Course 2013 26th June -
26th June 2013 -
Falmouth Tides (UTC): HW 07:20 5.1m
LW 13:50 0.3m
Cloud
cover: 100% -
Sea State: Flat -
Air Temperature: 14.9°C
Chemical Results
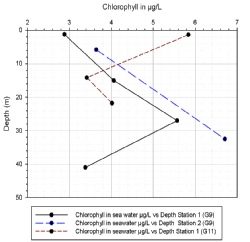
Chlorophyll
Chlorophyll (figure OC.1) gives an indication of abundance of phytoplankton in the water column (Fennel et. al. 2003). At station one (G9) the chlorophyll maximum occurs at a depth of 27 metres (m), just above the thermocline. At station two (G9), the chlorophyll maximum cannot be calculated as the sample taken at 16.4m was lost and therefore a reading was not possible. The Niskin bottle at 32.5 metres did not close properly when fired. However, the unclosed Niskin bottle sample is still shown as it may provide some indication of chlorophyll at depth. Station one (G11), shows an opposite profile to that of station one (G9), the chlorophyll minimum at station one (G11) is within 1m of the thermocline, with maximum chlorophyll at the surface.
Figure OC.1: Chlorophyll concentrations across station one and two (G9) and station one (G11)
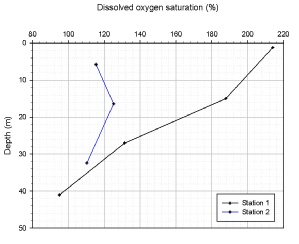
Dissolved Oxygen Saturation (%)
Dissolved Oxygen (O2) (figure C.2) can be used in combination with chlorophyll measurements to determine respiration and photosynthesis relationships. Station one (G9) shows the greatest decline and range in O2 saturation percentage from the sea surface to 41m. At station two (G9) there is little variation in O2 saturation percentage, with an increase at the thermocline. Station one (G11) shows the smallest variation throughout the water column in the amount of O2 saturation percentage. The general trend in dissolved oxygen saturation at all sites is that percentage of saturation decreases with depth. This shows that photosynthesis of phytoplankton communities decreases with depth and respiration dominates, with the exception of station two (G9) where the increase in dissolved oxygen saturation percentage at the thermocline indicates photosynthesis exceeds respiration.
Figure OC.2: Dissolved Oxygen Saturation (%)
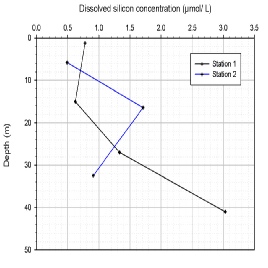
Silicon (Si)
Silicon (figure OC.3) is primarily used by diatoms to synthesise their siliceous frustules (Hecky et. al., 1973). Station one (G9) shows an increase in silicon with depth from 15 metres, with surface water showing a slight increase. Station two (G9) shows maximum silicon concentrations at the thermocline, with minimum values at surface and depth. Station one (G11) shows a similar profile to that of station two (G9), with less variation.
Figure OC.3: Dissolved Silicon Concentration
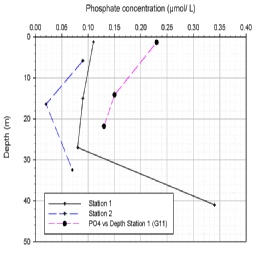
Phosphate (PO43-
Phosphate (figure OC.4) is required as part of the Redfield ratio (C:N:P 106:16:1)
by photoplankton for growth and energy production (Libes, 1992). The station one
(G9) PO43-
Figure OC.4: Phosphate Concentration
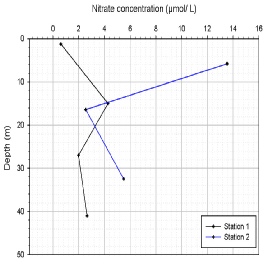
Nitrate (NO3-
Nitrate (figure OC.5) is also required as part of the Redfield ratio in phytoplankton
uptake. At station one (G9) we see an increase in NO3-
Figure OC.5: Nitrate Concentration
References
Fennel, K., Boss, E. (2003). Subsurface maxima of phytoplankton and chlorophyll:
Steady-
Hecky, R. E., Mopper, K., Kilham, P., Degens, E. T., (1973). The Amino Acid and Sugar
Composition of Diatom Cell-
Libes, S. M., (1992). An introduction to Marine Biogeochemistry John Wiley & Sons
Inc. 142 -
Parsons, T. R., Maita, Y., Lalli, C., (1984). A manual of chemical and biological methods for seawater analysis. Pergamon. 173
Offshore

| Introduction |
| Methods |
| Results |
| Discussion |
| Physical |
| Chemical |
| Biological |
| Physical |
| Chemical |
| Biological |
| Introduction |
| Methods |
| Results |
| Discussion |
| Physical |
| Chemical |
| Biology |
| Physical |
| Chemical |
| Biology |