University of Southampton Falmouth Field Course 2013 26th June -
26th June 2013 -
Falmouth Tides (UTC): HW 07:20 5.1m
LW 13:50 0.3m
Cloud
cover: 100% -
Sea State: Flat -
Air Temperature: 14.9°C
Introduction
Tidal fronts are determined by water depth and tidal currents. A front exists between tidally mixed waters (well mixed and close to shore) and stratified waters (water columns with increased depth).The position of the front is dependent on the tidal state and season. For example during spring tides, fronts move further offshore due to stronger turbulent mixing, enabling mixing to greater depths (Brown et al. 1999). The group chose to sample and collect data along a transect crossing the front in the shelf seas of Falmouth, in order to determine how vertical mixing processes effect the structure and functional properties of plankton and zooplankton communities both directly and indirectly.
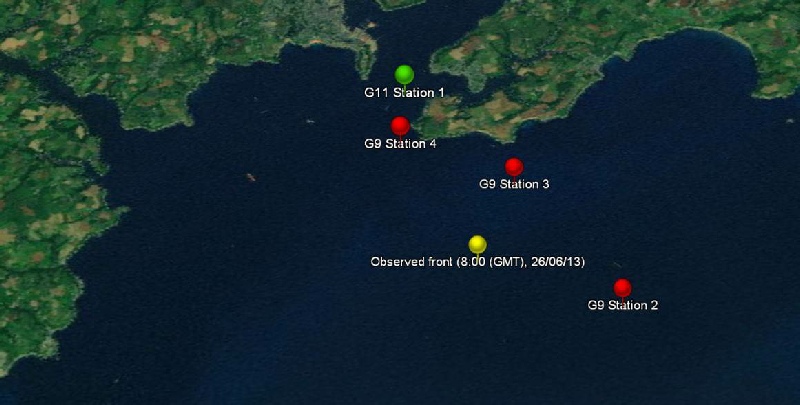
Four stations were chosen between Blackrock and ‘Station P2’, where it was known the front existed. ‘Station P2’ was chosen as the first station due to it having been sampled by University of Southampton Masters students in the previous weeks. This gave the option of using time series data at this particular location. Other stations over the front were sampled on the ebb tide to prevent sampling of the same body of water. On route to station 1, the on board CTD was monitored to locate the front. This information was used to determine the other sites chosen for sampling. The aim was to sample ‘Station P2’, the stratified side of the front, the front and the well mixed side of the front. Due to time restrictions water samples were not collected at stations 3 and 4; therefore to create a complete transect we collaborated data with Group 11. On route to station one group 9 (G9), the front was located at 50°07.326N, 004°57.750W.
Station 1
Location: 50°05.763N, 004°52.027W
Time: 08:23 09:59 UTC
Comments: CTD profile
taken from sea surface to 67.7m depth, water samples collected at 41m, 27m, 15m and
1.2m . Zooplankton mesh net deployed and closed between depths of 40-
Station 2
Location: 50°07.990N, 004°54.800W
Time: 10:33 -
Comments: Station
appeared on the cusp of the front as chlorophyll increased and temperature decreased.
CTD profile taken from sea surface to 50m, water samples collected at 32.5m, 16.4m
and 5.8m. Zooplankton mesh net deployed and closed between 20-
Station 3
Location: 50°08.507N, 004°58.185W
Time: 11:30 -
Comments: CTD rosette
deployed to ensure the front had not been missed, and RV Callista was still on route
to pass over the front. CTD deployed to 23m. Maximum depth was 24m. No zooplankton
measurements or water samples taken. Cloud cover 0/8.
Station 4
Location: 50°08.037N, 005°00.752W
Time: 11:55 -
Comments: The front
was not located. It was suggested that pockets of eddies, that had broken up the
front, were detected. CTD deployed to 11.7 m. Maximum depth was 13.1m. No zooplankton
measurements or water samples were taken. Cloud cover 0/8
Station 1 (G11)
Location: 50°08.691N, 005°001.472W
Time: 14:18
Comments: Water samples
collected at 21.8m, 14.1m, 15m and 1.3m . Zooplankton mesh net deployed and closed
between depths of 25-
Figure O.1: Map of station locations
Offshore
| Introduction |
| Methods |
| Results |
| Discussion |
| Physical |
| Chemical |
| Biological |
| Physical |
| Chemical |
| Biological |
| Introduction |
| Methods |
| Results |
| Discussion |
| Physical |
| Chemical |
| Biology |
| Physical |
| Chemical |
| Biology |