University of Southampton Falmouth Field Course 2013 26th June -
2nd July 2013 – Habitat Mapping
Falmouth Tides (UTC): HW 11.45 (1/6/13) 4.20m
LW 06:19 1.50m
HW 12:32 4.10m
LW 18:47 1.60m
True Wind Direction: South Westerly
True Wind Speed: 2ms-
Introduction
The Fal Estuary is home to two known species of maerl, both of which are protected
(Blunden et al. 1997). For this reason conservation programs are in place to protect
certain areas of the estuary. Also, habitat mapping of the estuary is important in
studying the anthropogenic consequences of developing the estuary further. Habitat
mapping and observation of the seabed can be used to locate areas of maerl and therefore
study the areas to protect. The maerl in Falmouth Estuary is protected by European
law and is a Special Area of Conservation (SAC) (Hall-
Side scan sonars are useful instruments that collect qualitative estimates of the
properties of the seabed lithology using acoustic backscatter (Blackinton et al.
1983). Side scan readings can then be interpreted to produce maps that can be useful
in habitat mapping. New developments in digital signal-
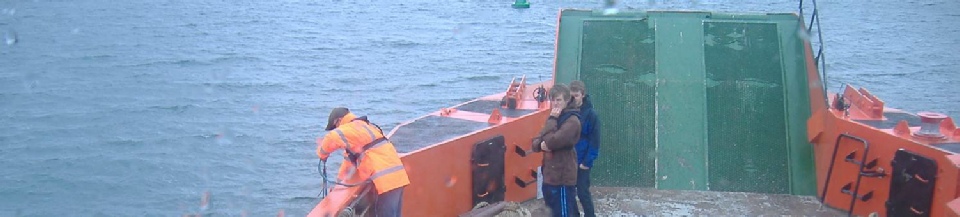
Upon boarding MTS Viking vessel seven reference points were chosen up the estuary and the vessel followed these as closely as possible. On this route a side scan sonar was used produced a map of the track and five video points were chosen to aid in habitat mapping of the surveyed area.
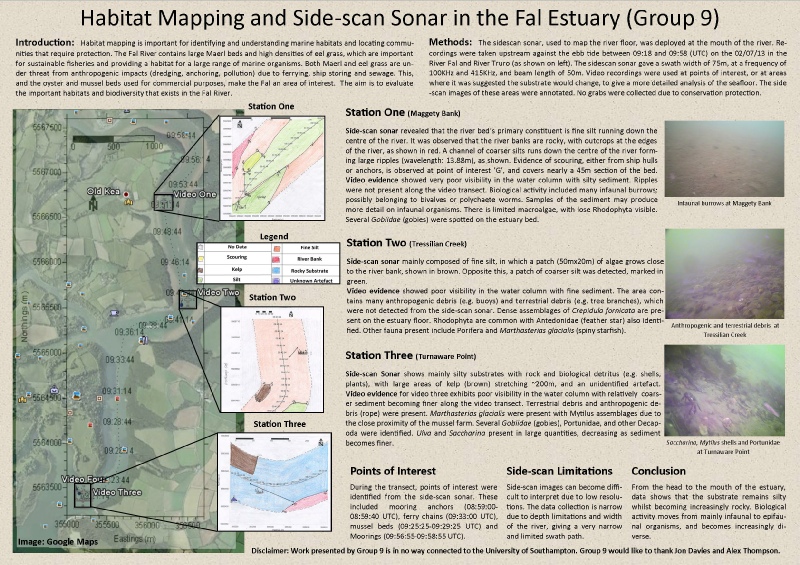
Figure G.1: Habitat Mapping Poster (Click to enlarge)
References
Blackinton, J., Hussong, D., & Kosalos, J. (1983). First results from a combination
side-
Blunden, G., Campbell, S. A., Smith, J. R., Guiry, M. D., Hession, C. C., Griffin,
R. L. (1997). Chemical and physical characterization of calcified red algal deposits
known as maerl. Journal of applied phycology. 9 (1), 11-
Hall-
Johnson, H. P., Helferty, M. (1990). The Geological Interpretation of Side-
Mitchell, A. J., & Collins, K. J. (2004). Understanding the distribution of maerl,
a calcareous seaweed, off Dorset, UK. Nishida, T., Kailola, PJ, and Hollinworth,
CE (Editors), 65-
Geophysical
| Introduction |
| Methods |
| Results |
| Discussion |
| Physical |
| Chemical |
| Biological |
| Physical |
| Chemical |
| Biological |
| Introduction |
| Methods |
| Results |
| Discussion |
| Physical |
| Chemical |
| Biology |
| Physical |
| Chemical |
| Biology |