University of Southampton Falmouth Field Course 2013 26th June -
4th July 2013 – Estuary Sampling
Falmouth Tides (UTC): HW 02:09 4.20m
LW 09:31 1.50m
HW 15:39 4.30m
LW 22.03 1.5m
Chemical Results
Depth Profiles
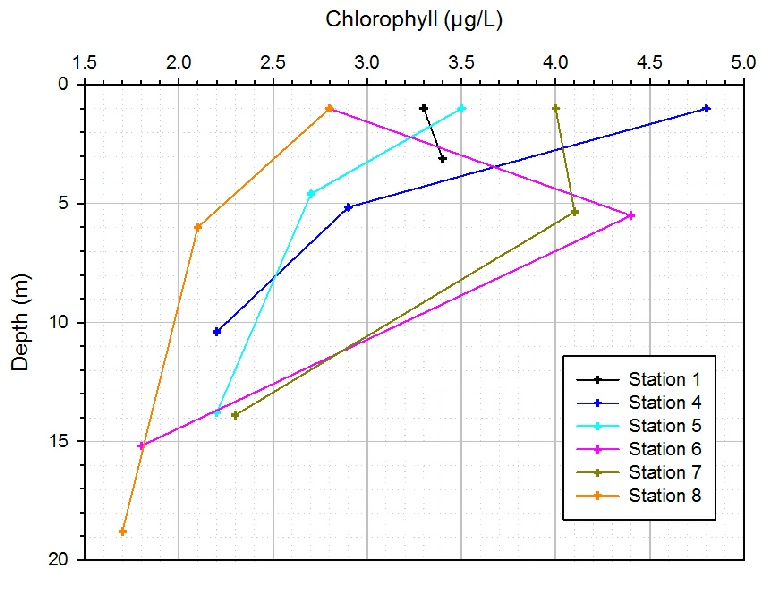
Figure EC.1: A vertical profile of chlorophyll with depth for all stations
Figure EC.1 shows the chlorophyll concentrations throughout the water column at each station. Station one only had 2 samples taken within a short distance to each other as the maximum depth was shallow because this station was the furthest up the river. The chlorophyll increases with depth by 0.1µg/L between 1m and 3m.
At station 4 there is an overall decline in chlorophyll concentration with depth, ranging from 4.8 µg/L at subsurface to 2.2 µg/L at approximately 10m depth. There is a gradual decline between 1m and 5m which becomes steeper between 5m and 10m. Station 5 follows the same trend as station 4 but ranges between 3.5 µg/L at 1m depth to 2.2 µg/L at approximately 14m depth. The range is smaller than at station 4 but larger than station 1.
Station 6 does not follow the trend of previous stations and increases between 1m depth and 6m by 1.7 µg/L. The chlorophyll concentration then sharply declines by 2.6 µg/L at 15m. Station 7 follows the same trend as station 6 but to a smaller scale as the initial increase between surface and middle depths varies by only 0.1 µg/L. It then decreases by 1.8 µg/L, less than the decrease between the middle and deepest depths at station 6.
Station 8 follows the same trend as 4 and 5 and decreases with depth. A deeper depth was sampled here, as this was our deepest station because it was the nearest to the mouth of the estuary. The range at station 8 is relatively small only declining by 1.1 µg/L over a depth of approximately 18m.
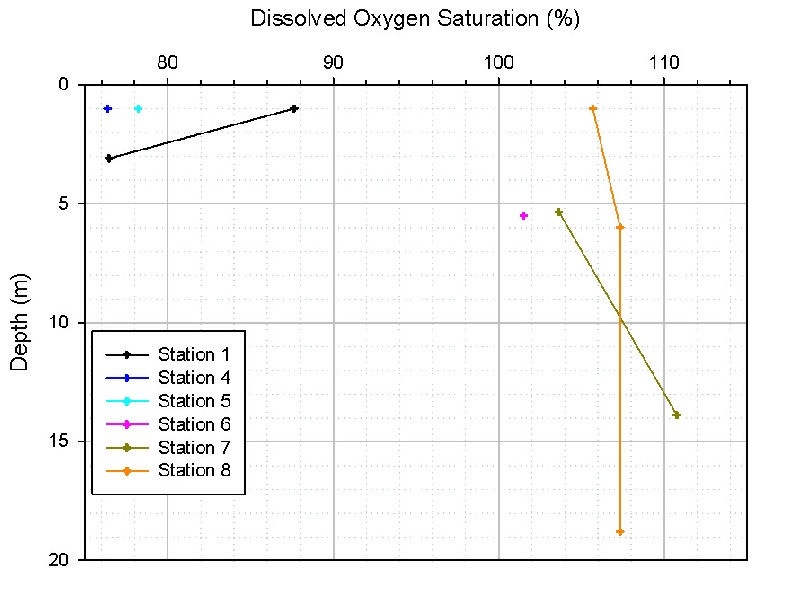
Figure EC.2: A vertical profile of dissolved oxygen saturation with depth for all stations
Dissolved oxygen was measured only at the surface at stations 1,2,3,4 but measured at a range of depths at stations 1,7 and 8, as seen in figure EC.2 . This meant that it was difficult to create a depth profile for the surface sampled stations. Station 6 was sampled at a depth of approximately 5.5m instead of the surface due to human error. At station 1 there was a decrease in dissolved oxygen with depth by approximately 12%. Station 7 saw an increase in oxygen saturation with depth from 104% to approximately 111%, however a surface measurement was not taken making it incomparable with station 1. At station 8 increased between the surface and 6m by only 2% and remained constant with depth below that.
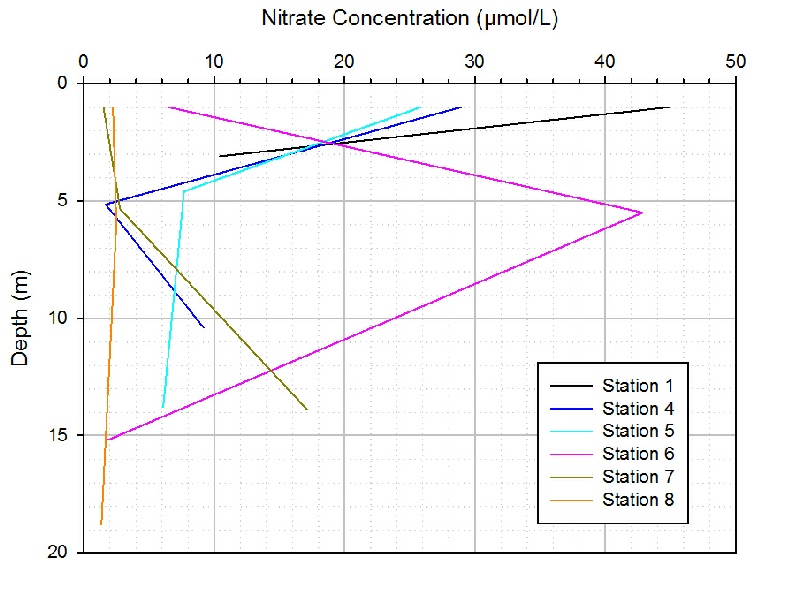
Figure EC.3: A vertical profile of nitrate concentration with depth at all stations
The nitrate concentration profiles at each station varied considerably between sites (figure EC.3). Only two sample depths were measured at station 1 due to the shallowness of the seabed. Station 1 showed a sharp decline of approximately 35 µmol/L between the two depths taken. Station 4 also declined in the upper part of the water column but then increased after a depth of approximately 5m, to 9 µmol/L. Station 5 follows a similar trend in the first 5m but below this it decreases very slowly by 1 µmol/L. Station 6 shows an opposite profile to station 4. There is a sharp increase in nitrate concentration in the first 5m from 0.6 µmol/L to approximately 43 µmol/L, where the concentration then decreases over the next ten metres to 15m depth by 41 µmol/L. Station 7 shows an increase in nitrate concentration throughout the water column with a small rise seen between 1m and 5m of approximately 1 µmol/L, becoming more pronounced between 5m (3 µmol/L) and 14m (17 µmol/L). At station 8 there is a slight decreases of less than 1 µmol/L between the subsurface measurement and 18m depth.
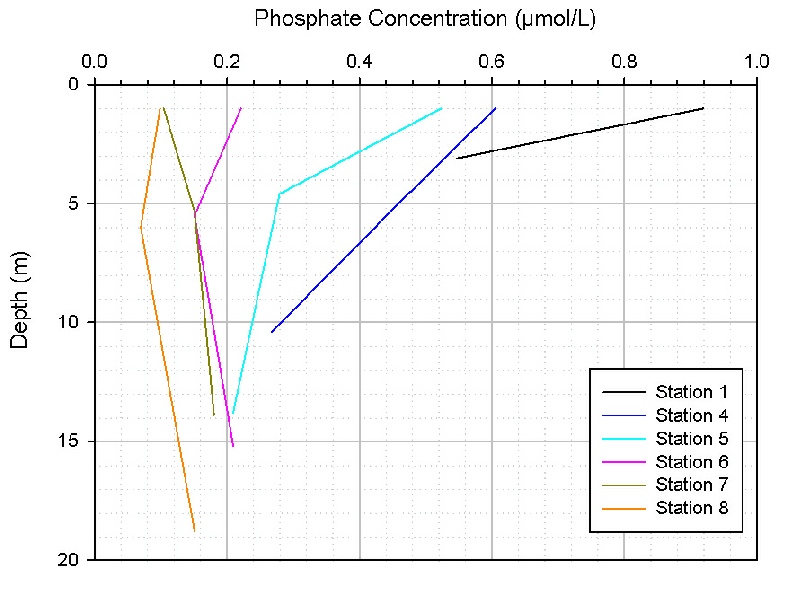
Figure EC.4: A vertical profile of phosphate concentration with depth at all stations
The phosphate concentration decreases down the estuary from station 1 to station
8 (figure EC.4). At station 1 concentration decreases sharply between 1 and 3 m depth
from approximately 0.92 µmol/L to 0.56 µmol/L. Station 4 experiences the same trend
in phosphate concentration decrease as station 1, although more gradual, with a decrease
from 0.6µmol/L to 0.28 µmol/L over approximately 10m. Station 5 shows a sharp decrease
in concentration from subsurface to 4.5m of approximately 0.24 µmol/L which then
decreases on a less steep gradient down to 14m from 0.28µmol/L to 0.2µmol/L. Stations
6 and 8 exhibit the same trend of decreasing from subsurface to the mid-
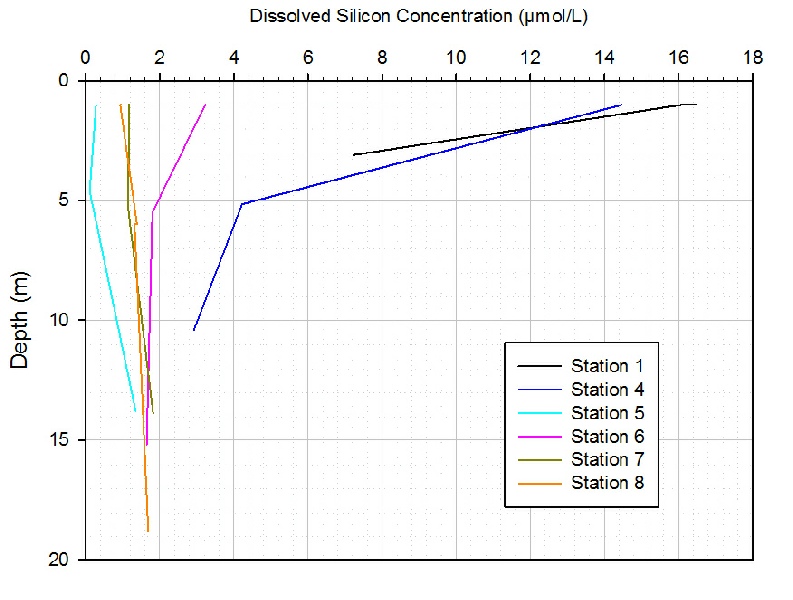
Figure EC.5: A vertical profile showing dissolved silicon concentration with depth for all stations
Station 1 displays the steepest gradient of silicon depletion of all the stations, with concentration falling from 16.4µmol/L to 7.2µmol/L between 1 and 3 m. Station 4 also shows a sharp depletion between the subsurface measurement (14.4µmol/L) and the 5m depth measurement (4.2µmol/L) where the gradient then shallows and concentration falls by 1.2µmol/L in approximately 5m. Dissolved silicon concentrations are lowest at station 5 with a subsurface concentration of approximately 0.2µmol/L which then decreases by less than 0.1µmol/L to 5m depth where the concentration increases to 14m from approximately 0.1µmol/L to 1.3µmol/L. Concentrations at station 6 decrease in the upper section of the sampled water column by 1.5µmol/L down to approximately 5.5m followed by a shallow and steady decrease by less than 0.4µmol/L to the deepest measurement. Trends for stations 7 and 8 are similar with both increasing very steadily through the whole sampled water column by less than 1µmol/L.
Estuarine Mixing Diagrams
River end Members
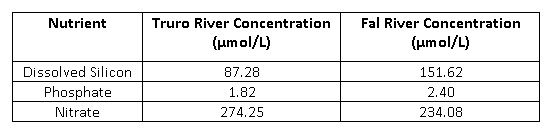
River end members were provided, and sample 4 was chosen as a estuarine end member for the Truro River due its sampling location (as shown in figure X), and sample 8 for the Fal River estuarine end member. These were used to create the theoretical dilution line (TDL) and mixing diagrams. River end member nutrient results, as shown in table EC.1, vary between the two chosen end members, with dissolved silicon showing largest change. It is important to note that in the Truro River salinity appears to decrease towards the mouth of the estuary, as pockets of fresh water were discovered.
Table EC.1
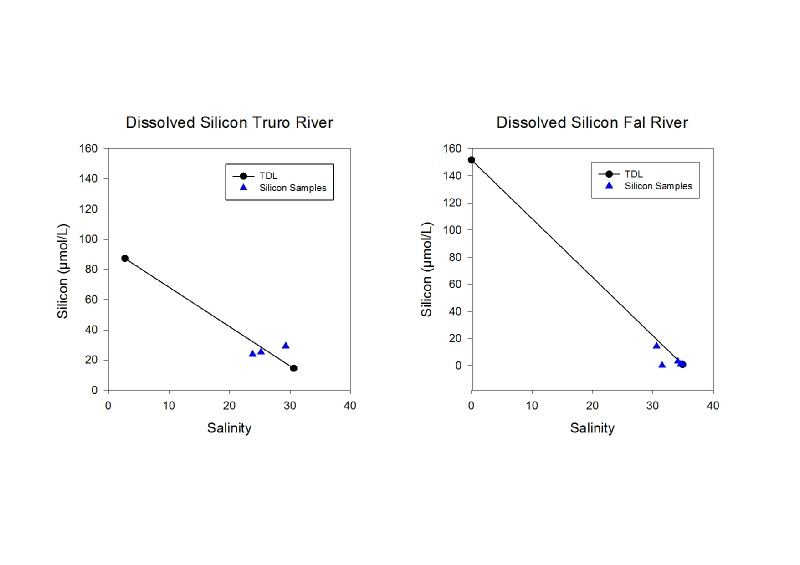
Dissolved Silicon Mixing Diagram
In the Truro River, where dissolved silicon end member concentrations are approximately 65.34µmol/L lower than the Fal river end member concentration, dissolved silicon exhibits conservative behaviour. In the Fal River, data points lay on or below the TDL.
Figure EC.6: Dissolved Silicon Mixing Diagram
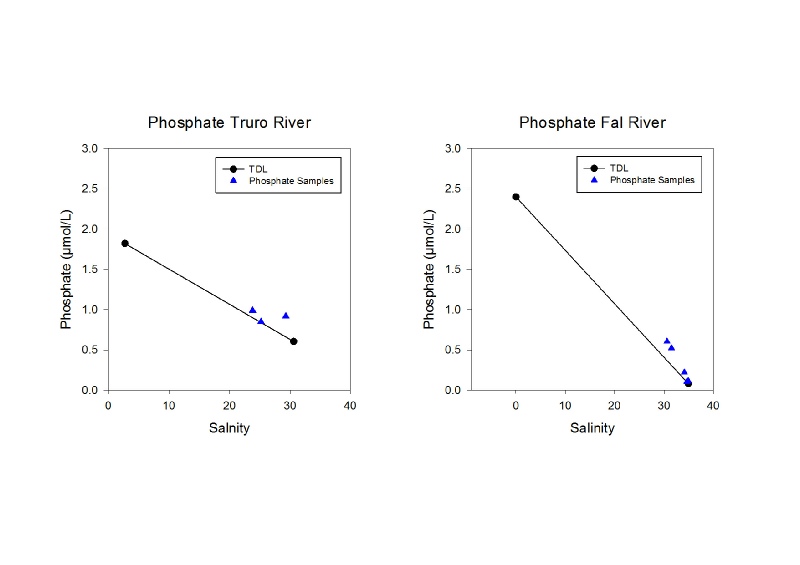
Phosphate Mixing Diagram
Phosphate difference between the two river end members is approximately 0.58µmol/L.
The Truro River exhibits conservative behaviour with data points laying mostly above,
but close to, the TDL. In the Fal River, all data points lay above the TDL. Although
close to the TDL, due to the high salinities the phosphate appears to act non-
Figure EC.7: Dissolved Phosphate Mixing Diagram
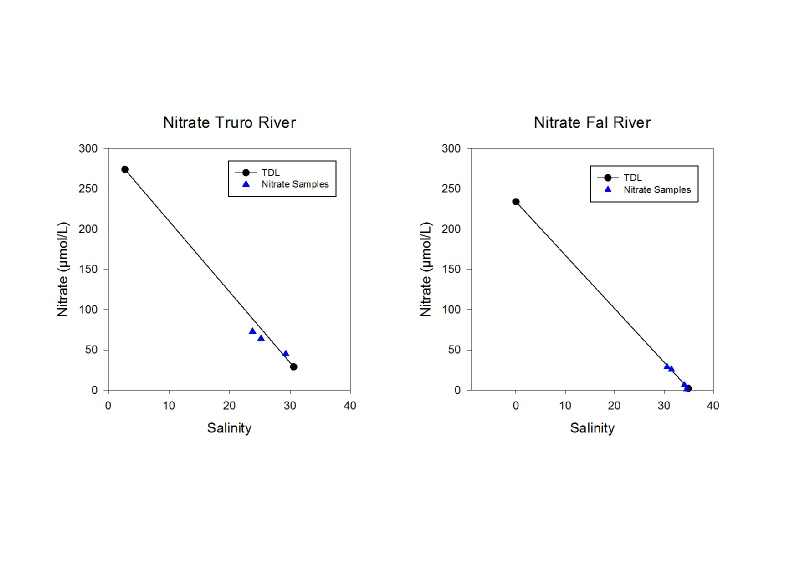
Nitrate Mixing Diagram
Nirate differences between the two river end members is approximately 40.17mol/L. Both Rivers show conservative behaviour, with the Fal River data laying mostly on the TDL. The slope of the TDL between each river is very similar, suggesting that data points may be able to lay on one TDL with the river end member from either site.
Figure EC.8: Dissolved Nitrate Mixing Diagram
Estuary
| Introduction |
| Methods |
| Results |
| Discussion |
| Physical |
| Chemical |
| Biological |
| Physical |
| Chemical |
| Biological |
| Introduction |
| Methods |
| Results |
| Discussion |
| Physical |
| Chemical |
| Biology |
| Physical |
| Chemical |
| Biology |