Falmouth Field Trip 2014-
This website reflects the opinions of students and not the views of the University of Southampton or the National Oceanography Centre.
Produced by: Alice Duff, Philippa Fitch, Joanna Gordon, William Harris, Thomas Jefferson,
Eirian Kettle, Jesse Marshall, Dominique Mole, Emma-


Phytoplankton
Zooplankton
Estuary -
Results -
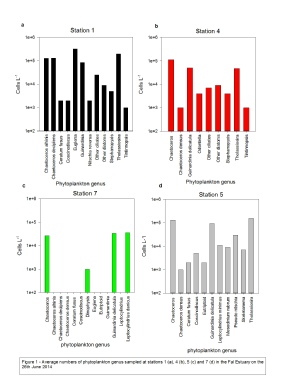
At Station 4 six genera were found, 5 of which were diatoms and 1 of which was Tintinnina.
Abundance was dominated by Chaetoceros with 1.1 x 10⁵ cells L-
Nine genera were found at Station 5, of which 7 were diatoms, 1 was a dinoflagellate
and 1 ciliate genus. The water column at this site was dominated by Thaliossiosira
with an abundance of 1.5 x 10⁵ cell L-
A notable drop in diversity of genera is seen at Station 7. 4 genera are found overall,
3 of which are diatoms and 1 of which is a dinoflagellate. Abundance was also notably
smaller, the highest biomass from Leptocylindrius being 3.6 x 10⁴ cells L-
Figure 2 shows some images of the phytoplankton found.
Discussion -
As the salinity increases the biodiversity stays equal to that seen at station one
however at station 5 the biomass has reduced to ~50% of that seen at Station 1. Station
7’s significant drop in both abundance and diversity is likely due to the salinity
changes (∆s=1.669 from station 5-
Results -
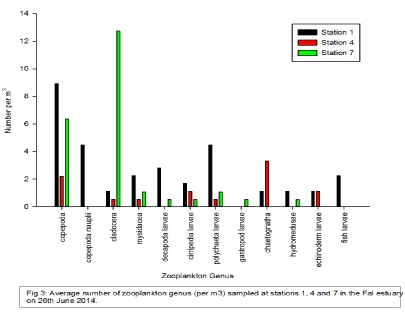
Station 4 showed intermediate numbers of each zooplankton genus with the exception of the copepod abundance which was lowest at Station 4. No Hydromedusae were present in samples taken from Station 4. The most dominate genus at Station 4 was Chaetognatha (3.3/m3).
At Station 7 cladocera abundance was high(approximately 12 times greater than at Station 1 and 4). Copepoda were also present in high numbers (6.4/m3). However, all other recorded zooplankton genera were found in low numbers, no greater than 1/m3. Gastropod larvae were only found at this station but Chaetognatha, echinoderm larvae and fish larvae were not present.
Discussion -
Our results show that larvae tend to reside higher up stream within the estuary. This is typical as larvae require high nutrient concentrations and low turbidity (conditions found within the upper Fal estuary).
Copepoda are found throughout the estuary however their numbers are lowest at Station 4. This may be due to the fact that Station 4 was sampled during high tide. This could have resulted in zooplankton migrating from the mid estuary in order to graze on phytoplankton being flushed upstream. Chaetognatha numbers increase more than twofold from Stations 1 to 4 but they were not present at Station 7. This could be due to an increase in predation as Chaetognatha are an important prey for fish
Larink & Westheide, 2011). At Station 7 the estuary widens and more rivers feed into
the Fal estuary therefore there would be a greater diversity of predators. Chaetognatha
also prefer temporal and permanent stagnant waters (Forro et al., 2008). This could
also explain the lack of Chaetognatha at Station 7 as turbidity, and thus mixing,
increased from the head to the mouth of the estuary (from station 1-
Cladocera numbers are approximately 12 times greater at Station 7 than at the other
stations. Cladocera are found in almost all ponds, lakes and slow flowing rivers
but only a few species secondarily invade the marine pelagia (Larink & Westheide,
2011). Therefore, it is unusual that an increased number was found at the mouth of
the estuary. This could be due to a number of variables, the first being the recent
rainfall. After a period of dry weather, several days of rainfall may have resulted
in an increase of riverine flow. This could have caused flushing of the estuary and
thus a shift downstream of zooplankton. This would affect this species, Cladocera,
in particular due to its small size, 0.2-
Figure 4 -
Figure 2 -
Click to enlarge
Click to enlarge
| Geophysics |
| References |
| Introduction |
| Physical |
| Chemical |
| Biological |
| References |
| Introduction |
| Results |
| References |
| Introduction |
| Physical |
| Chemical |
| Biological |
| References |