Lab Procedures
Chlorophyll - Chlorophyll was measured using a fluorometer (blanked with 90% acetate)
and the value for chlorophyll in sea water was calculated using (acetate vol/sea
water vol) x fluorometer reading. (Parsons et al., 1984)
Dissolved Oxygen - Dissolved oxygen concentrations were measured and calculated using
the Winkler method (Grasshoff et al., 1999) (1ml of sulphuric acid was used to dissolve
the precipitate). A titrator was used to titrate the samples with sodium thiosulfate
- an optical end point was used during the titration. Oxygen concentration was calculated
from this by dividing by 4.
Nitrate - Nitrate concentrations were measured using flow injection analysis after
being re-filtered (filter with 25mm diameter, 0.45µ pore size, PVDF durapore) (Johnson
and Petty, 1983). The samples were injected into the into a carrier stream and were
mixed with reagents in a mixing tube. A spectrometer was then used to measure the
pink colour produced and the signals were recorded automatically on a chart. The
peaks on this chart were measured by hand and calibrated using 3 standards.
Phosphate - Phosphate concentrations were measured by diluting stock solution to
produce 3 replicates of each standard and blank solution. Reagents (ascorbic acid
and potassium antimonyl tartrate) were added to the samples as well as the standards
and blanks and left to react for an hour. Repeats were taken every 5 samples. A spectrophotometer
was then use to measure absorbance. A calibration curve from created suing the standards
was used to calculate phosphate concentration for each sample (See for full methods
Parsons et al. 1984)
Silicon - Dissolve silicon concentrations were determined using methods outlined
by Parsons et al. (1984). Mixed Reducing Reagents were added to the sample and left
for a period of 2 hours. Standards and blanks (3 repeats) were also prepared. Absorbance
for the samples (standards and blanks) was measured using a U-1800 spectrophotometer
at 810nm and a calibration curve was drawn. The silicon concentrations for the samples
were then calculated from the calibration curve.
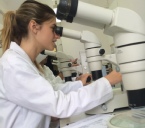
Phytoplankton - 100ml water samples with iodine added to preserve the cells were
taken in order to analyse phytoplankton. 1ml sedgewick-rafter chambers were then
used to examine the sample under a microscope. The counts were scaled up to the sample
volume by multiplying by 1000.
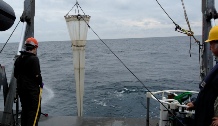
Zooplankton - Formalin was added to water samples taken in order to analyse zooplankton.
Using microscopes, the number and species of zooplankton found were recorded. The
abundance of zooplankton per litre of seawater was calculated using the volume of
water sampled through the net (calculated with data from the flow meter)
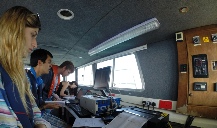
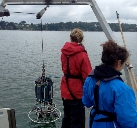
Equipment
CTD Rosette instruments and makes – Smart CTD, Niskin bottles (General Oceanics),
transmissometer (Sea Teaching; serial number T1015), fluorometer (Wet Labs, serial
numbers WS3S-4OOP).
ADCP – 1200kHz
Conway zooplankton net mouth diameter (measured using a tape measure) was 50cm and
mesh size was 200µm.
Callista closing zooplankton net mouth diameter of 63cm with mesh size of 200µm.
Bottle types – Glass bottles used for nitrate, phosphate, dissolved oxygen and iodine
staining. Water samples taken for dissolved silicon were stored in plastic bottle
(to reduce contamination).
Glass fibre filters of pore size 0.7µm used on the boats and pontoon
Lab instruments and makes – fluorometer (Turner 12), titrator (Metrohm 665 Dosimat),
flow cytometer (pump: Minipuls 3, Gilson; UV/VIS spectrometer:
Unicam 5625, serial number 2580), U-1800 Spectrophotometer (Hitachi).
25mm diameter, 0.45µm pore size, PVDF durapore used in the lab.
Microscopes – phytoplankton microscopes (GMXL1500); zooplankton microscopes (Nikon
SMZ800)
YSI multi-sensor probe (OSIL)
Flow meter (Valeport)
Hydropro navigation system (version 2.02.16)
Geoacoustics dual frequency side scan sonar tow-fish
CODA octopus processing system
Richardson number calculation
Richardson Number
Ri = ((-gdp)/p)*(dz/du2)
Richardson number <0.25 is turbulent flow
Richardson number >1 is laminar flow
Note: For any difference in the direction of adjacent flows greater than 90˚, the
current magnitude was added together leading to a greater current shear.
References - See Estuary, references