Falmouth Field Trip 2014-
This website reflects the opinions of students and not the views of the University of Southampton or the National Oceanography Centre.
Produced by: Alice Duff, Philippa Fitch, Joanna Gordon, William Harris, Thomas Jefferson,
Eirian Kettle, Jesse Marshall, Dominique Mole, Emma-


Click figures to enlarge
Phytoplankton
Results
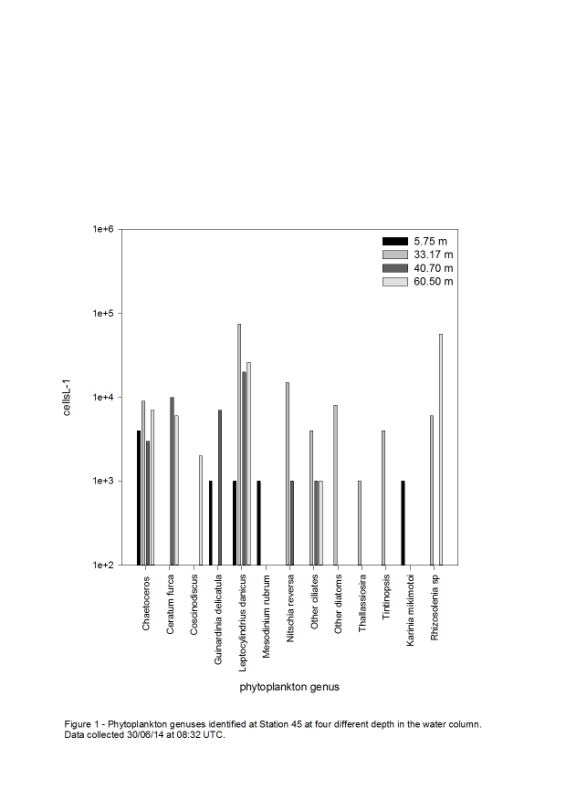
Station 45
13 different genera of phytoplankton were identified in the samples from Station 45. Chaetoceros were dominant, showing a slight decline in abundance at 40.70m followed by an increase again at 60.50 m. These fluctuations in abundance are likely to be due to counting error rather than natural patterns as abundance is expected to decrease with depth. Counting errors may have been introduced as six people analysed the phytoplankton samples. The greatest diversity of phytoplankton was seen at 33.17 m . This was expected as it was the depth of the chlorophyll maximum indicated on the CTD depth profile. The surface reading at 5.75m showed the lowest diversity and generally had the lowest count.
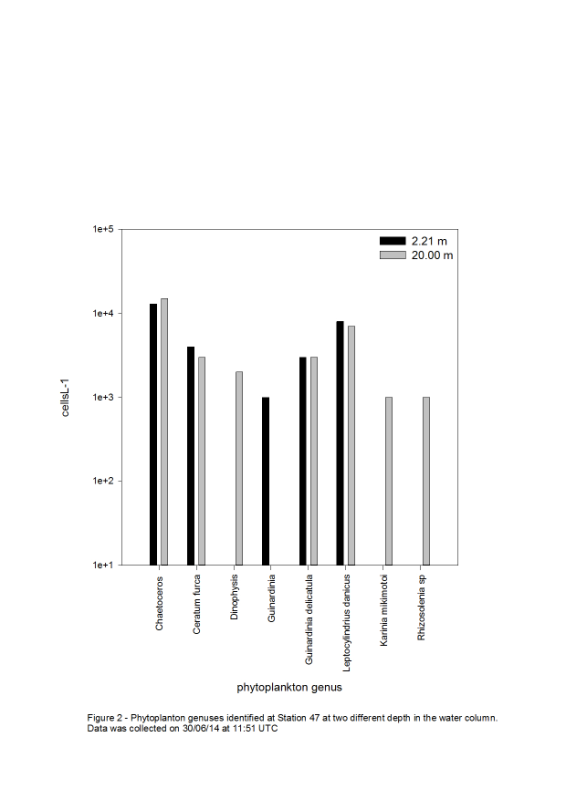
Station 47
There was less diversity at Station 47 than Station 45 with only 8 genera of phytoplankton
identified. Chaetoceros was dominate at both depths sampled, but was slightly more
abundant at 20m. Leptocylindrius danicus also follows this pattern. Ceratum furca
was present at both depths (8000 cells L-
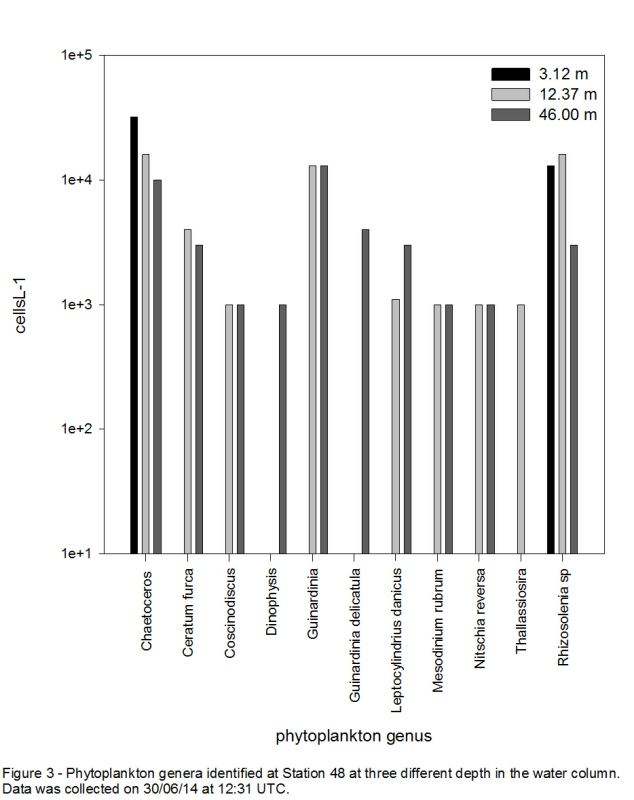
Station 48
A greater diversity of phytoplankton were identified at Station 48 than were presents
at Station 47. However, from the 11 genera identified, only 2 were found in surface
water at 3.12 m depth; Chaetoceros and Rhizosolenia sp. Chaetoceros were found in
their highest numbers in the surface waters (32000 cellsL-
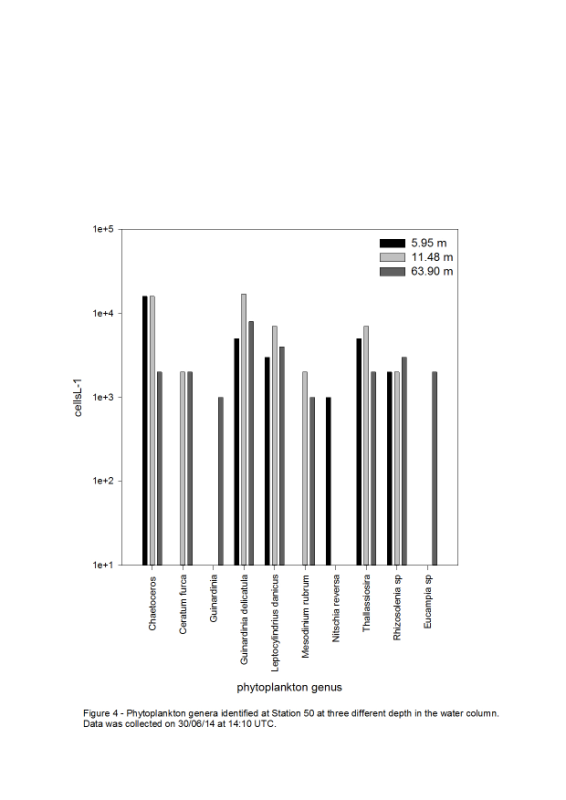
Station 50
10 phytoplankton genera were identified at Station 50. From the CTD depth profile,
the chlorophyll maximum was shown to be approximately 12m. The highest counts of
phytoplankton tend to be in the samples collected at 11.48m, with the exception of
Guinarfinia and Eucampia spp which were only present in the 63.90m samples and Nitschia
reversa which was only identified at 5.95m samples. There was a higher diversity
of phytoplankton in the 63.90m sample, but the number of phytoplankton tended to
be lower. Surface numbers were also generally lower except for Chaetoceros, Guinardinia
delicatula and Thallassiosira which were all present in fairly high numbers (<5000
cells L-
Discussion
Phytoplankton tend to be lower at the surface samples than the deeper samples. This pattern is probably due to the phytoplankton remaining at the nutricline where nutrients are high rather than at the surface where nutrients are limited. The phytoplankton that were present at the surface may be more efficient at utilising the small amount of nutrients or may have already absorbed the nutrients they require so can remain shallow water to photosynthesis. Chaetoceros is considered one of the largest genus of marine plankton with approximately 400 species (von Quillfeldt, 2001). This could explain why they dominated phytoplankton numbers at each station as it is hard to distinguish between species so they were grouped together.
Zooplankton
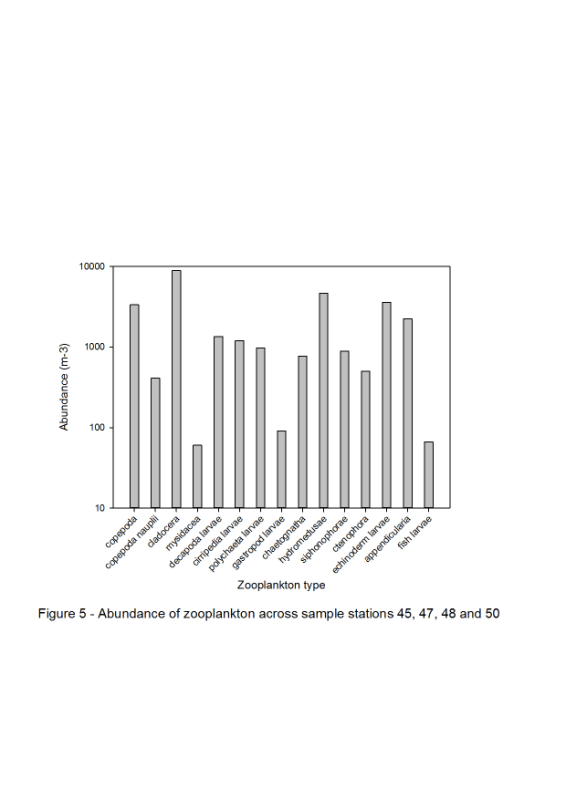
Overall, 15 phyla of zooplankton were identified. The most abundant phyla were Cladocera (621 individuals; 8899m3), Hydromedusae (285 individuals; 4671m3), Echinodermata (235 individuals; 3571m3) and Copepoda (224 individuals; 3348m3). All but Echinodermata was found at every station and depth sampled. Station 50 was a front, indicating notable differences in water densities, temperature, salinity, nutrients and chlorophyll. This correlated with the high abundance and diversity of zooplankton found at the site compared to the other stations sampled (Figure 5).
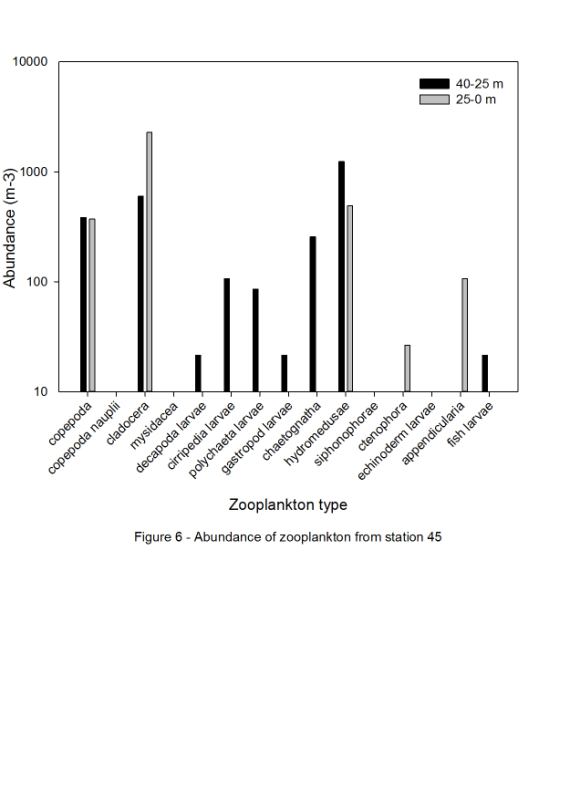
Station 45: 11 Phyla of zooplankton were identified, 3 of which were found at both
depths. The results show a consistent abundance of hydromedusae and copepoda from
45m to the surface. 9 phyla were found between 25-
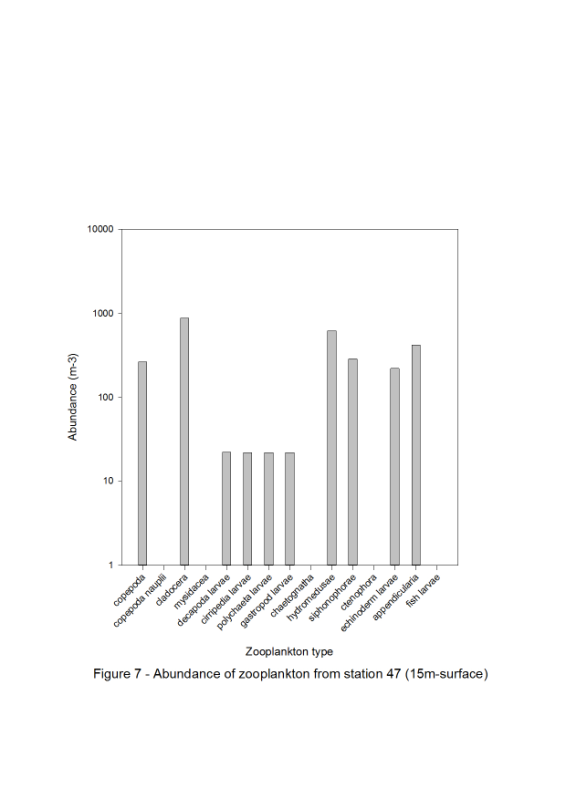
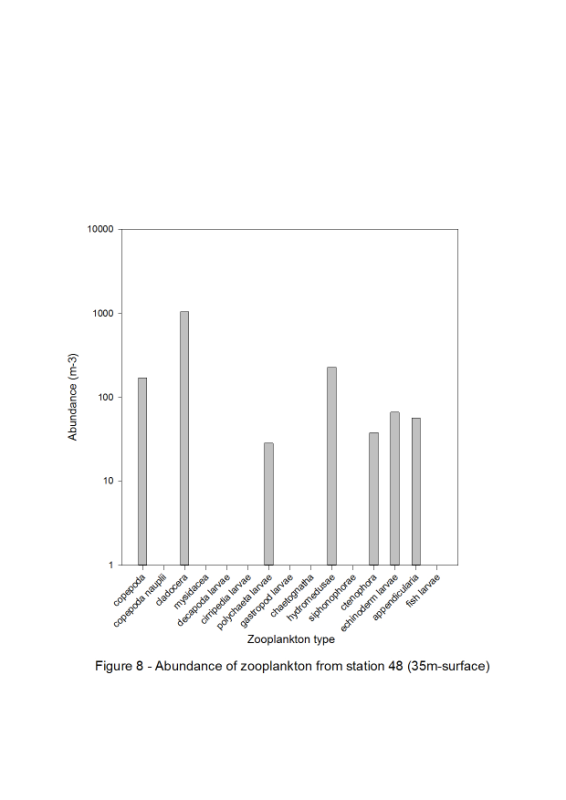
Figure 7 and Figure 8 show the results for zooplankton type and abundances at Stations 47 and 48 (respectively). These stations were not located on the frontal system so zooplankton abundance reflect typical patterns for conditions found on the landward side of fronts.
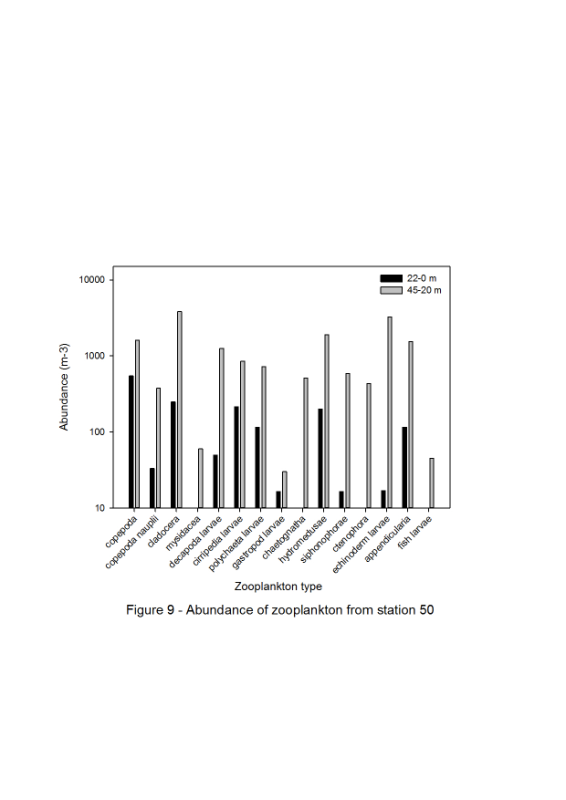
Station 50: 15 phyla of zooplankton were found at this location. All 15 were found below 25m and 11 were found above 25m. However, a clear prevalence of zooplankton biomass can be seen below 25m. This was the most abundant station with a significant increase in phyla and individuals recorded. This is most likely due to time constraints on other stations’ sample analysis. The data collected indicates a front at the area of sampling. The notable difference in velocity within the surface 10m ( 0.859 m/s at 15m – 0.519 m/s at 26m) indicates the differences in density of two water bodies associated with a front. The reduction of nutrient availability (Si 4.36, PO4 0.37, N 2.33) compared to other stations (Station 45: Si 4.6, PO4 0.37, N 2.28) and the increase in chl (1.0408 v) compared to Station 45 (0.304), indicated areas of high productivity. This correlates with the high level of heterotrophs found. (Figure 9).
Offshore -
| Geophysics |
| References |
| Introduction |
| Physical |
| Chemical |
| Biological |
| References |
| Introduction |
| Results |
| References |
| Introduction |
| Physical |
| Chemical |
| Biological |
| References |