Falmouth Field Trip 2014- Group 3

This website reflects the opinions of students and not the views of the University of Southampton or the National Oceanography Centre.

Produced by: Alice Duff, Philippa Fitch, Joanna Gordon, William Harris, Thomas Jefferson, Eirian Kettle, Jesse Marshall, Dominique Mole, Emma-Jo Pereira, Joshua Walton

Home Geophysics Estuary Pontoon Offshore Appendix

Estuary - Chemical


Nitrate

Phosphate

Silicon

Dissolved Oxygen

Chlorophyll

Grp03NitrateMixing.JPG Grp03PhosphateMixing.JPG silicon mixing diagram.JPG Grp03PhosphateProfile.JPG Grp03NitrateProfile.JPG Grp03SiliconProfile.JPG Grp03DOprofile.JPG

Results - The mixing diagram for phosphate (Figure 1) shows no clear behavioural trend in the estuary. There is slight deviation from the Theoretical Dilution Line (TDL) with points plotting both above and below. Phosphate profiles (Figure 2) show that at Stations 3,4 and 7 phosphate concentrations follow the expected trend of decreasing with depth. As expected phosphate increases slightly with depth at Station 1 and 5. The largest range in phosphate was seen at Station 4 with a change of 0.15µmol/L. There is little correlation seen between the salinity profiles (Figure 1) and the phosphate profiles (Figure 2).


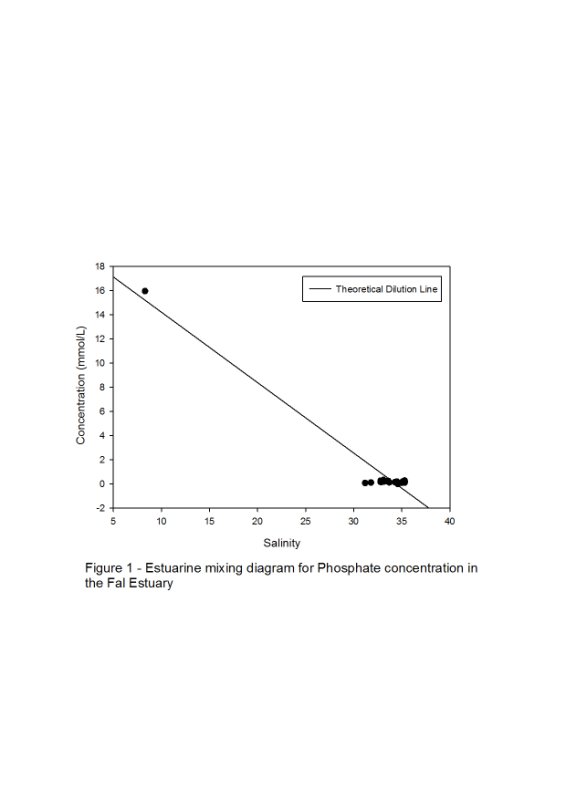
Discussion – Phosphate behaviour is unclear due to the small salinity range at which the samples were collected. The deviation of the points from the TDL in Figure 1 indicates there may be both addition and removal of phosphate, suggesting behaviour can be both conservative and non-conservative within the Fal estuary. Phosphate addition has previously been observed in the Fal Maeir (2009). This can be caused by sewage inputs, old mine drainage sites (Station 5) and agricultural runoff (Station 1) (Langston et al., 2006). Station 3 shows removal of phosphate, suggesting planktonic species are using it as an essential nutrient for photosynthesis. Non-conservative behaviour is expected to be as a result of addition due to many input sources into the Fal estuary. Although small, evidence of removal is unusual. Station 7 was sampled when high tide was rising so tidal flow was strong, hence phosphate can be adsorbed onto particles and drawn down to the sediment. This could explain the decrease in concentration with depth (Figure 4).


Results - The mixing diagram for nitrate (Figure 3) shows no clear behavioural trend in the estuary. There is slight deviation from the TDL with points plotting both above and below.

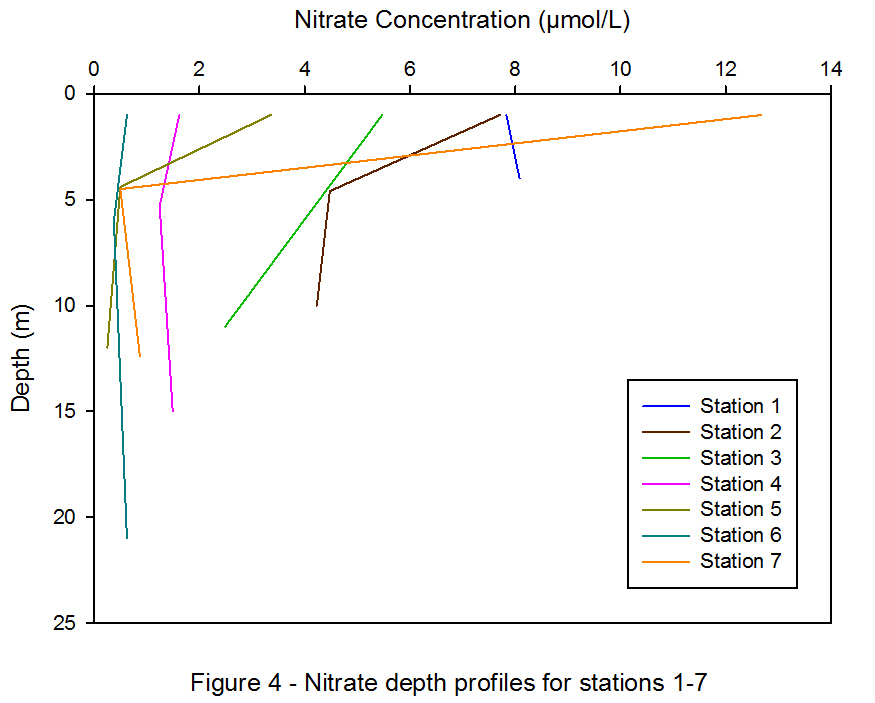
Nitrate profiles (Figure 4) show that nitrate concentrations decreased with depth at all stations except Station 1. Station 7 has the largest range in nitrate concentration (12.7µmol/L).


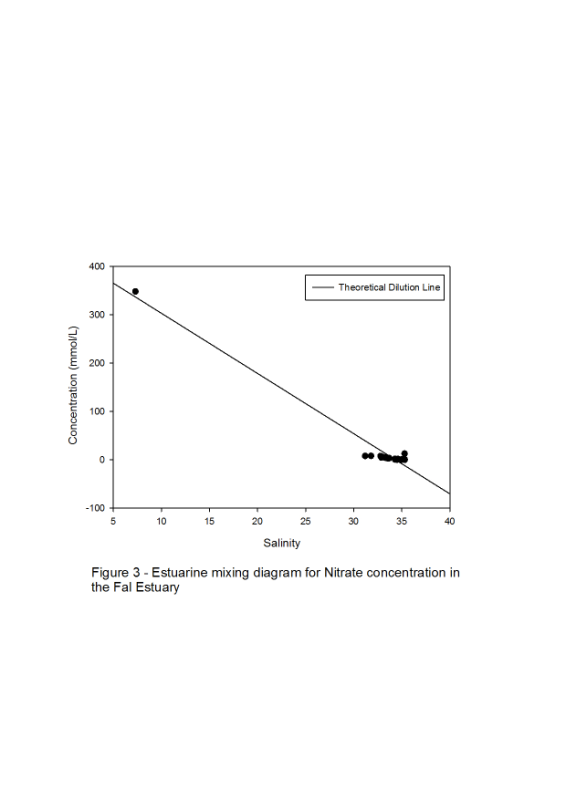
Discussion – Nitrate behaviour is unclear due to the small salinity range at which the samples were collected. The deviation of the points from the TDL in Figure 3 indicates there may be both addition and removal of nitrate. Addition of nitrate has been observed at Station 1. This could be due to river water providing the majority of biologically important compounds to estuaries (Day et al., 2012). Sewage inputs are not as important for nitrate compared with phosphate. This is because sewage is treated for nitrate inputs, but not phosphate, suggesting that nitrate should behave more conservatively than phophate shown in Figure 3 (Langston et al., 2006). Stations 2-7 show decrease in nitrate concentration shown in Figure 4 indicating removal of nitrate could be occurring through planktonic species using it for photosynthesis. Burial into sediments and denitrification could also be another reason for removal occurring. Station 5 was located near old mine drainage sites but no nitrate increase is shown in the depth profile suggesting this is not a significant nitrate source (Langston et al., 2006).


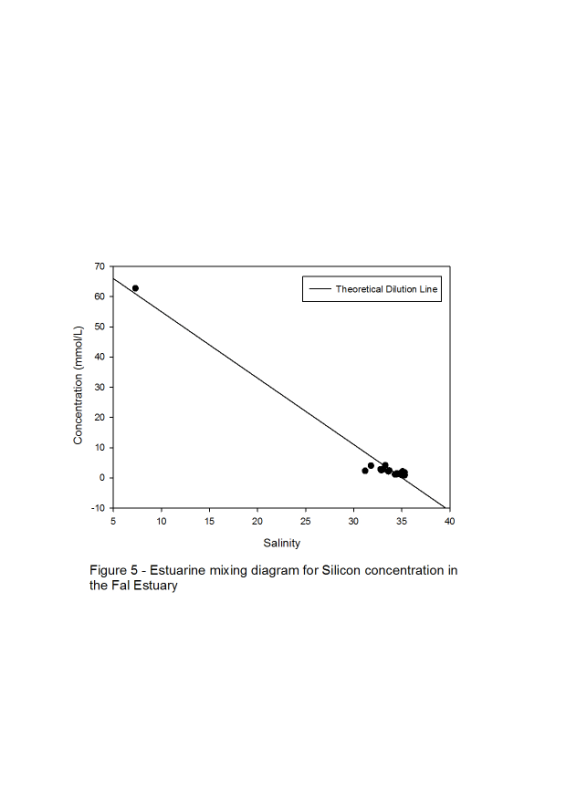
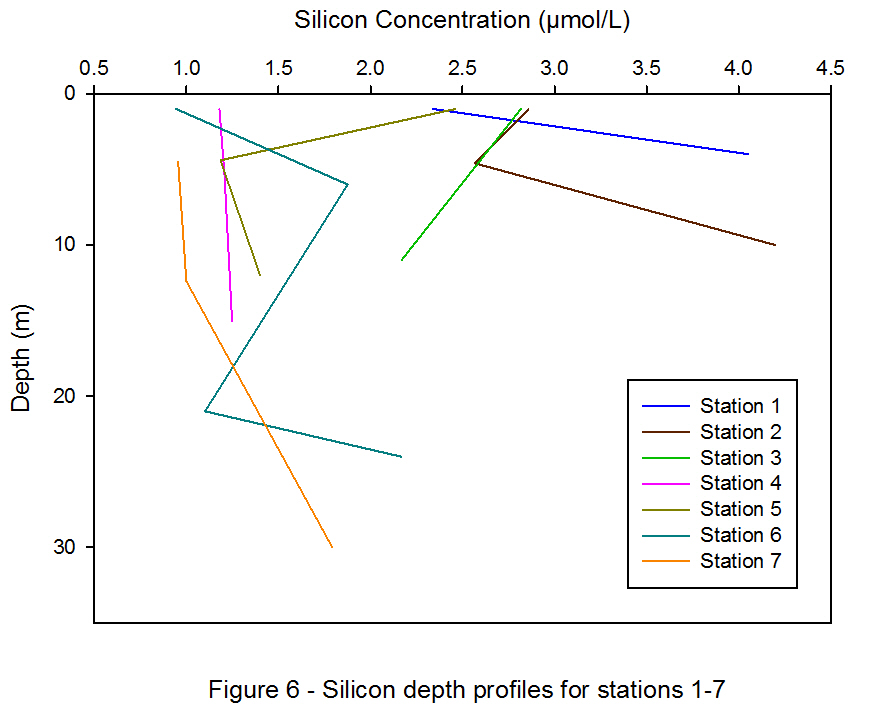
Results – The mixing diagram for silicon (Figure 5) shows no clear behavioural trend in the estuary. Points plot both above and below the TDL with slightly less deviation seen when compared to nitrate and phosphate mixing diagrams. At Stations 3 and 5 silicon profiles are seen to follow the expected trend of decreasing with depth. The remaining stations show an increase in silicon with depth (Figure 6). The largest range in silicon was seen at Station 1 with a change of 1.8µmol/L.


Discussion - Silicon behaviour is unclear due to the small salinity range at which the samples were collected. The slight deviation of the points from the TDL in Figure 5 indicates there may be both addition and removal of silicon. The primary source of dissolved silicon is lithogenic input, with the products of chemical weathering of continental rocks discharged into rivers (Treguer and Rocha, 2013). Due to Station 1 and 2’s location at the top of the estuary this could be the reason for increase in silicon with depth (Figure 6)  Dissolved silicon is an essential nutrient for important phytoplankton species, including diatoms (Smyth et al. 2009). Stations 3 and 5 show removal of silicon suggesting uptake of dissolved silicon for formation of opal skeletons (Statham, 2012).


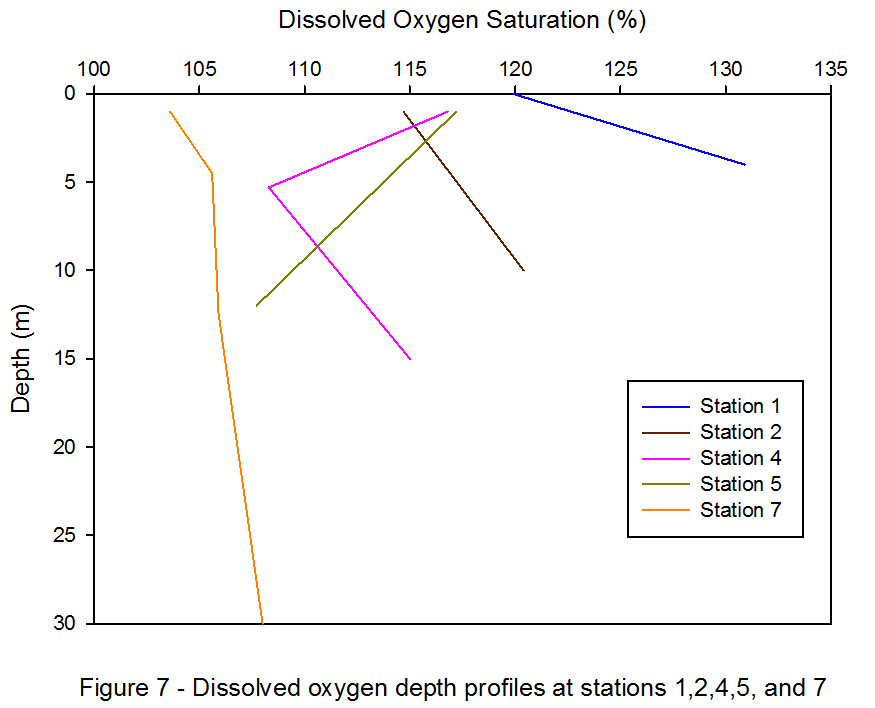
Results –At Stations 1, 2 and 7 dissolved oxygen increases with depth and at Stations 4 and 5 a decrease with depth is seen (Figure 7). The largest range in dissolved oxygen was seen at Station 1 with a change of 11%.


Discussion – Supersaturation is shown at all stations (Figure 7). Stations 4 and 5 are located approximately mid-estuary where depth has increased compared to the top of the estuary. Here biological activity should increase and so deplete waters of dissolved oxygen (Burkholder 2009). Station 7 was sampled when high tide was rising, suggesting that tidal factors may have caused an increase in dissolved oxygen with depth through turbulence and mixing processes. Stations 1 and 2 are located near the Truro area, where sewage is inputted. This may have an effect on dissolved oxygen saturation through bacterial decomposition of organic matter (Langston et al., 2003). Lack of sampling bottles meant samples were only taken at 5 stations. The 5 stations were chosen to give the best overview of the estuary and more samples were taken where vertical profiles showed the greatest change.


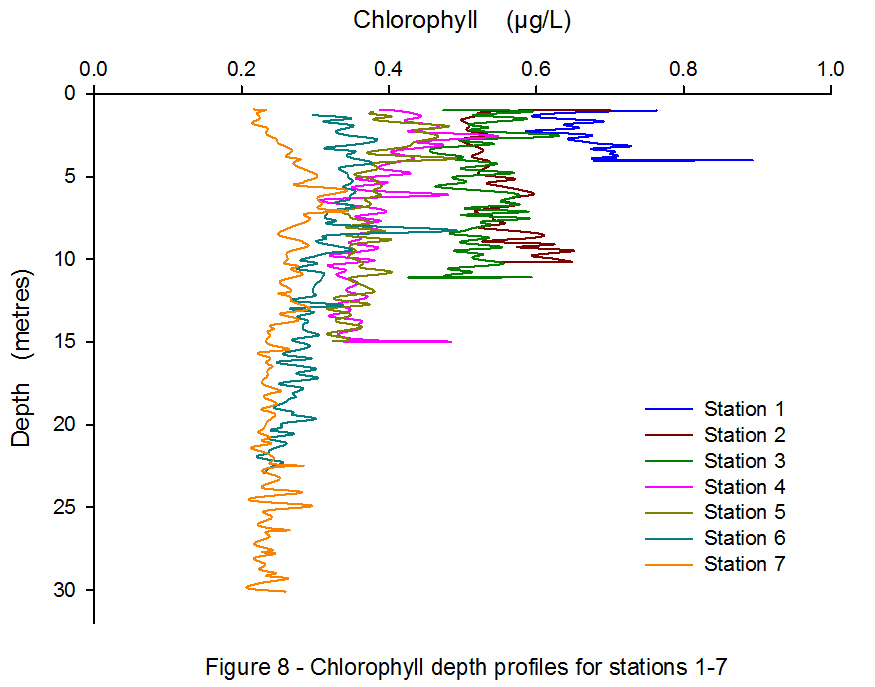
A reducing gradient of chlorophyll can be seen as the sample sites move away from the riverine end member to the mouth of the estuary, with a mean chlorophyll values of 0.668v at Station 1 and 0.257v at Station 7. At Stations 1, 3 and 4, peaks in chlorophyll can be seen between 0-5m where chlorophyll concentrations increase by ~0.2v.

Station 7, the most saline station sampled, shows the most constant and the lowest chlorophyll values throughout the water column. This is potentially due to the lower turbidity levels at the estuary mouth (4.62 v at Station 7) than at the river source (4.19v) indicating a lower attenuation level and thus a greater likelihood of autotrophs spreading vertically through the water column. The dynamic nature of the riverine end of the estuary is likely causing the greater variation of chlorophyll due to greater temporal and spatial changes of salinity, transmission and nutrient input.


Grp03ChlGraph.JPG