Falmouth Field Trip 2014-
This website reflects the opinions of students and not the views of the University of Southampton or the National Oceanography Centre.
Produced by: Alice Duff, Philippa Fitch, Joanna Gordon, William Harris, Thomas Jefferson,
Eirian Kettle, Jesse Marshall, Dominique Mole, Emma-


Offshore -
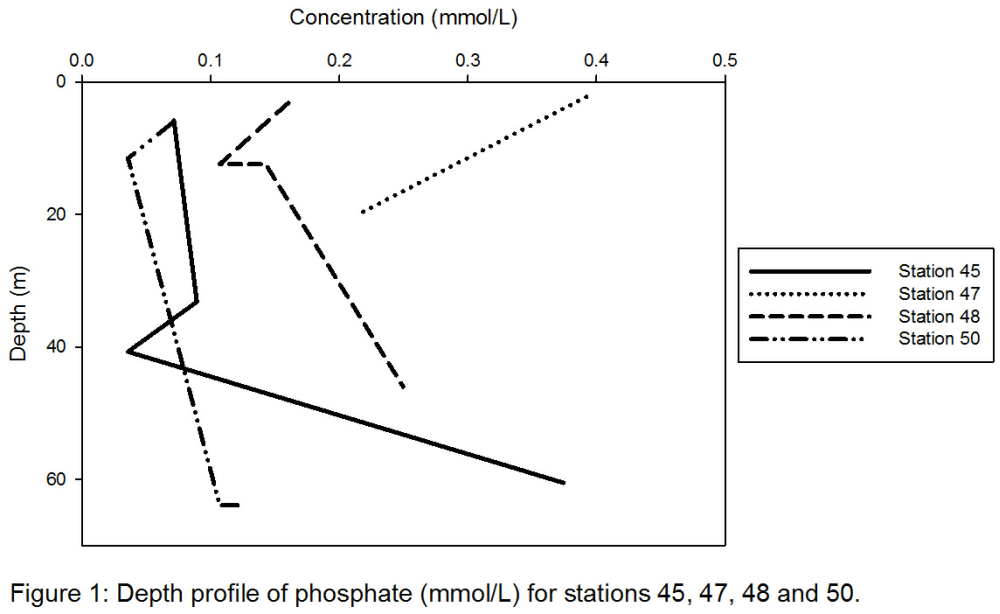
Phosphate
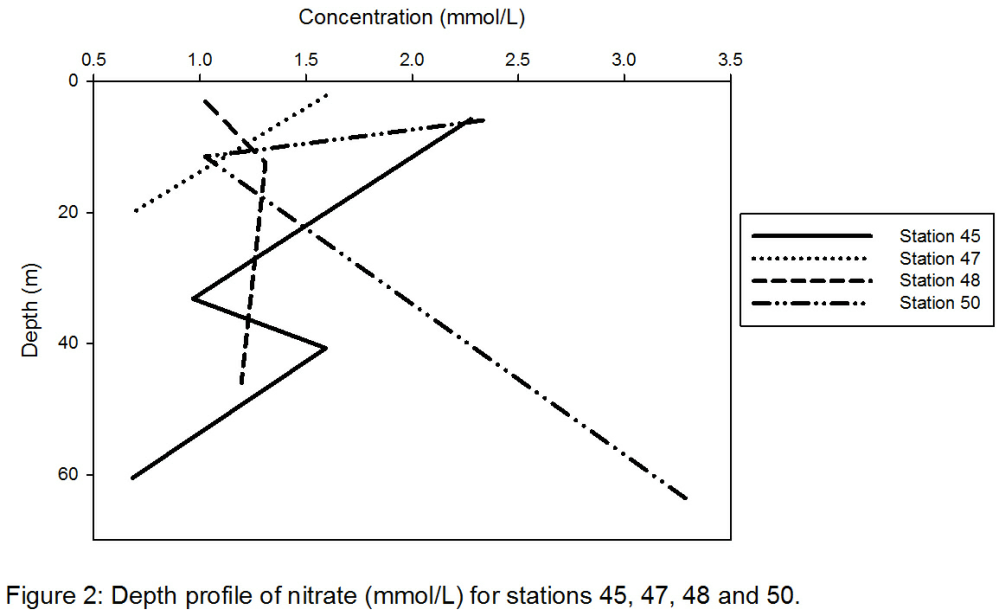
Nitrate
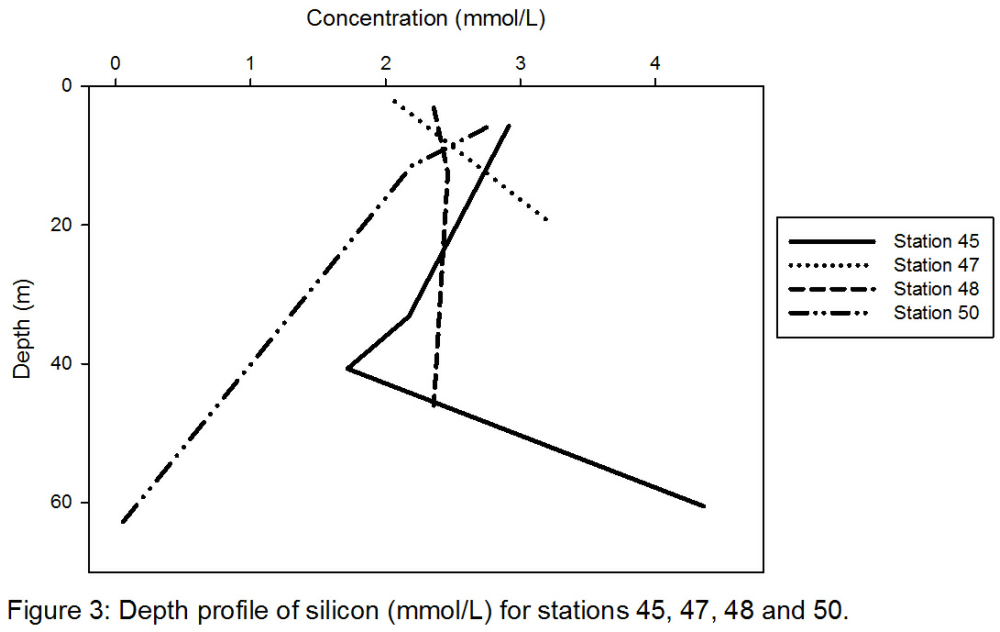
Silicon
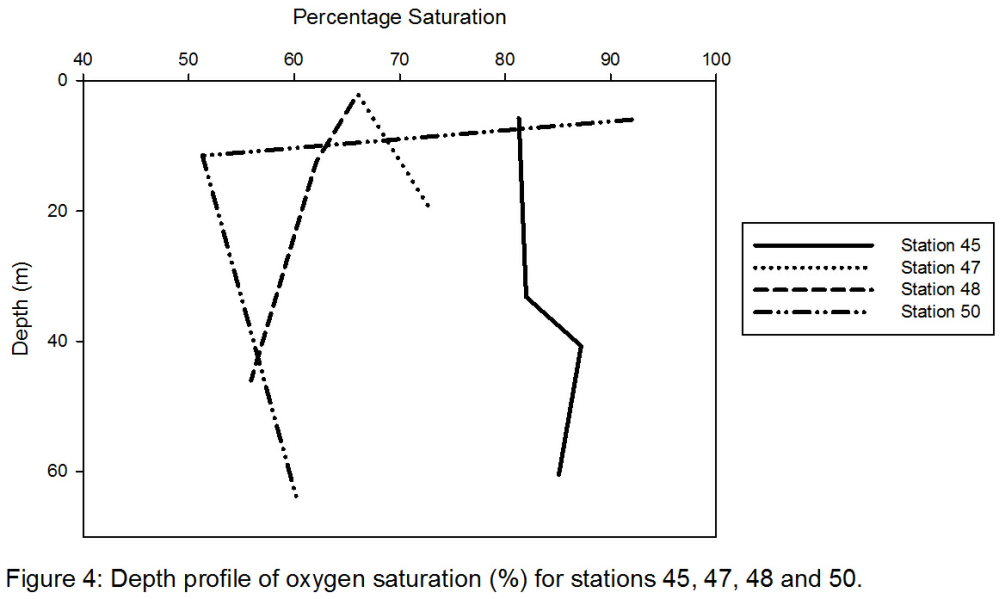
Dissolved Oxygen
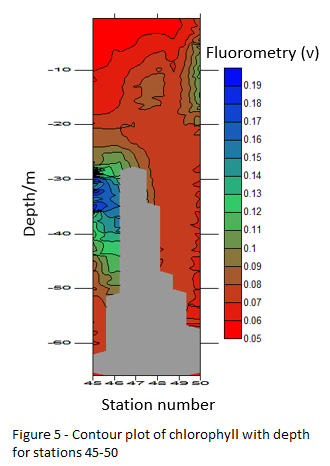
Chlorophyll
Phosphate concentrations ranged from 0.04mmol/L to 0.39mmol/L, with the majority of stations having increasing concentration with depth (see Figure 1). Station 47 however shows a decrease in phosphate from the surface to around 20m. This station had the highest reading of all recorded (39mmol/L) for its surface sample. The other three stations began with more similar readings at the surface, all between 0.7mmol/L and 0.16mmol/L. Station 45 had a sharp increase in concentration at around 40m depth, from 0.04mmol/L to 0.37mmol/L.
With further distance from the coast, phosphate values were seen to decrease, probably due to the increased uptake by biota combined with the lack of nutrient input further out to sea. Plankton blooms occurring in the spring would deplete much of the phosphate stores. Stations 45 and 50 are shown to be frontal systems which typically increase biomass production of plankton (Miller, 2004). This may cause a depletion of nutrient stores. The sharp change at around 40m for station 45 suggests a chlorophyll maxima at this point, therefore depleting phosphate within this area due to the higher phytoplankton abundance (see figure 5).
Concentrations plotted in Figure 2 show a range of values for nitrate (from 0.68mmol/L to 3.3mmol.L). No obvious pattern with depth across all stations can be seen. Two stations (45 and 50) had sharp changes with depth, at around 11m for Station 50 and between 33m and 40m for Station 45. Station 50 was also significant in that there was an increase of almost 1mmol/L concentration shown from the surface to 60m. Little variation was seen at Station 48, although there is a small decrease with depth. Stations 45 and 47 however have larger decreases through the water column with sharp gradients between sampling depths, and ranges in concentrations of 2.28mmol/L to 0.68mmol/L (Station 45) and 1.59mmol/L to 0.68mmol/L (Station 47).
Interestingly the nitrate concentrations at the two frontal stations have similar
surface values but differ throughout the water column. This could be due to changing
plankton species at each frontal system, therefore requiring different nutrient amounts.
The large changes with depth seen at Station 50 could be explained again by the frontal
system found here, with the minimum at 11m suggesting a sub-
Each station varied with the silicon concentrations found. Station 48 showed similar values of around 2.4mmol/L across the profile from the surface to 46m (Figure 3). Depletion with depth was seen at Station 50 however, decreasing from 2.75mmol/L at the surface to 0.01mmol/L at 63m. Contrastingly the other two stations (45 and 47) both showed an increase in concentration with depth, with a sharp increase between 40m and 60m for station 45. Across all stations, a range of 4.35mmol/L was seen with the largest differences occurring at depths of around 60m. All surface readings were more similar as they were all between 2.07mmol/L and 2.75mmol/L.
Low silicon values shown within figure 3 are indicative of phytoplankton uptake such as that by diatoms (Klais et al., 2011). A diatom bloom could explain the large increase in silicon with depth for station 50, as a surface increase in production may therefore promote high silicon deposition. Station 48 suggests little diatom production due to the constant concentration with depth, however a deep sample was not taken here which could have provided more information. The increasing silicon concentration with depth at station 47 could be explained by a coastal input as there is little chlorophyll at this station (Figure 5) and it is closest to the shore, therefore could be easily influenced by agricultural runoff (Nixon, 1995).
Oxygen saturation data (shown in Figure 4) showed large differences in oxygen values between the sample sites. The largest fluctuation was seen at station 50, from 92% at the surface to 51% at 11m to 60% at 64m, however the other sites had smaller variations through the water column, with ranges of 5.2%, 6.9% and 9.7% respectively for stations 45, 47 and 48. Surface values were all above 65%, nevertheless no consistent trend with depth could be seen.
Oxygen saturation values are important to understand the biological workings through the water column. The data shows each station to be under saturated as there are no readings at at or above 100%. Station 50 however does have surface values of 92% suggesting large amounts of photosynthesis taking place, supporting the conclusion that a frontal system iis present at this station. The rapid decrease after this is likely to be an anomaly within the data because a drop of 40% is unusual. Stations 47 and 48 again show little fluctuation suggesting little production or depletion of oxygen at these points. Changes in values at around 40m for Station 45 suggests a frontal system, with a high abundance of phytoplankton producing oxygen at this depth.
Click figure to enlarge
Click figure to enlarge
Click figure to enlarge
Click figure to enlarge
Chlorophyll is not present below 50m at any of the stations. At stations with more
coastal locations (45,46), chlorophyll maxima occur at approximately 30-
Click figure to enlarge
| Geophysics |
| References |
| Introduction |
| Physical |
| Chemical |
| Biological |
| References |
| Introduction |
| Results |
| References |
| Introduction |
| Physical |
| Chemical |
| Biological |
| References |