
OFFSHORE RESULTS
AND DISCUSSION


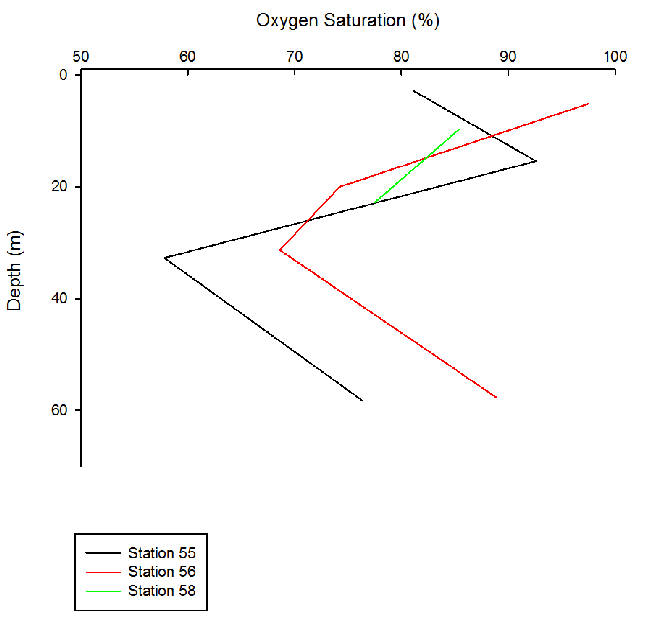
Figure 3. The percentage oxygen saturation with depth at stations 55, 56 and 58 along a transect carried out offshore aboard the R. V. Callista. The profile for stations 55 and 56 are made up of 4 samples at various depths whereas the profile for 58 is comprised of only 2 points.
Results:
The profiles for both 55 and 56 consist of 4 sampling points giving a clear profile
throughout the water column. However, the samples retrieved from station 58 where
unable to be processed on return to the dry lab resulting in limited profile points
for this station. All profiles exhibit their highest percentage saturation in the
top 20m, with station 56 being the highest. Generally the oxygen levels then decrease
until a low point (for stations 55 and 56) at around ~30-
Discussion:
From figure 3 it is clear that the highest percentage saturation for all three stations
is in the top 20m of water, the area of water column where irradiance levels are
higher. These high irradiance levels promote the activity and growth of phytoplankton
potentially resulting in greater oxygen levels in surface waters. Further evidence
for the presence of phytoplankton is seen in both nutrient profiles in figure 7 and
figure 8 as in both nutrients are removed from surface waters suggesting phytoplankton
uptake. Moving further down the profile, both stations reach a minimum at ~30-

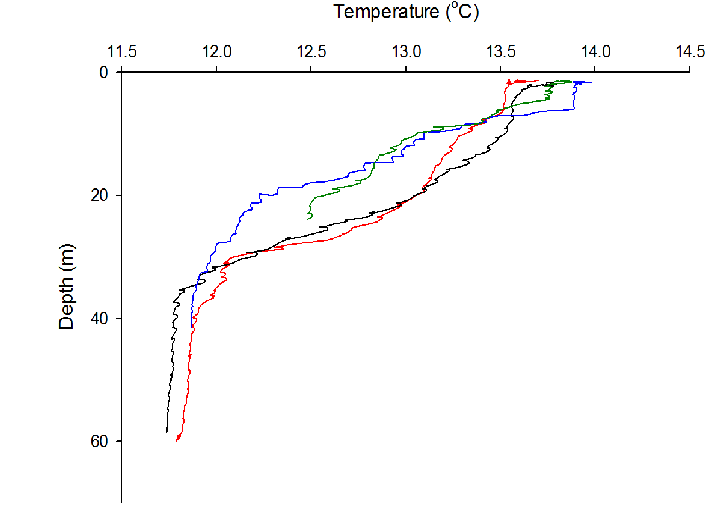
Figure 1. Temperature depth profile for each station (55-
Results:
Station 55 surface temperature starts off at ~13.7 °C consistent down to around 7 metres depth, where the temperature decreases to 13 °C by 24 metres depth where it decreases down to 12 °C by ~30 metres staying constant at this temperature down to the seabed. Station 56 has a slightly higher surface temperature (13.75 °C). By 10 metres depth the temperature decreases by 0.25 °C, continuing to decrease to 11.8 °C down to ~33 metres where it again stays at this constant temperature down to 60 metres. The penultimate station has the highest surface temperature (14.9 °C). At 5 metres depth the temperature decreases rapidly down to 13.5 °C, continuing to decrease down to 11.8 °C at 35 metres depth. Lastly, station 58 was much shallower in depth (only 22 metres maximum). The temperature starts off at about 13.75 °C decreasing by 1.25 °C at 20 metres (down to 13.5 °C).
Discussion:
Firstly, temperature is higher at the surface of the water because of the effect of solar heating on this layer; temperature decreases with depth down in the water column because of the lessening effect of solar heating of water at depth (NOAA, 2015). Secondly, with deeper water comes a deeper thermocline. This is because there is less tidal influence (thus with shallower water nearer the coastline – stations 57 and 58 – comes a shallower thermocline due to more tidal influence).

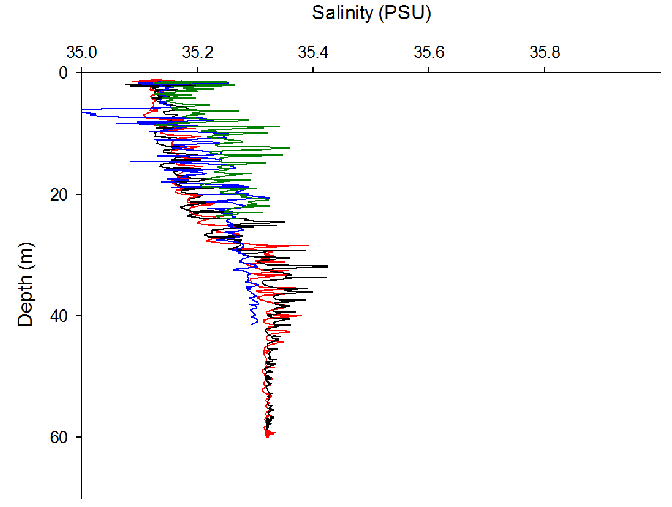
Figure 2. Salinity depth profile across all 4 stations sampled. The data has many salinity spikes however general trends can be deduced. The stations all have a very similar surface salinity value (between 35.1 PSU and 35.25 PSU). The salinity stays relatively constant between all stations sampled (only increasing slightly in each case with depth) up until about 30 metres (at stations 55, 56 and 57) where the salinity increases from ~35.2 PSU to 35.3 PSU, staying constant with depth down to the sea bed. However, the mass of noise in the form of salinity spikes makes this depth profile very hard to read and deduce definitively leading to difficulty with interpretation.
Results:
There are many salinity spikes (increasing and decreasing due to a high degree of noise which adds uncertainty into the data which make the data very messy and difficult to read. However, ignoring the various spikes, a trend can be deduced; salinity generally increases with depth at ~34 metres from ~35.2 PSU up to 35.3 PSU (for all stations except 58 where the salinity sees a peak between 8 metres and 17 metres from 35.2 PSU up to 35.3 PSU then back down to 35.2 PSU again).
Discussion:
The salinity spikes make any sort of deduction of the data difficult, however looking past these spikes at the general shape of the profile allows a simple trend to be seen; due to one main contributing factor. Water with a higher salinity sinks below that with lower salinity due to the contribution this makes to their respective densities. Higher salinity and cooler temperature results in a higher density, whereas lower salinity and warmer temperature leads to a lower density (Millero et al., 1976). This is secondarily reinforced by figure 1; temperature decrease with depth.

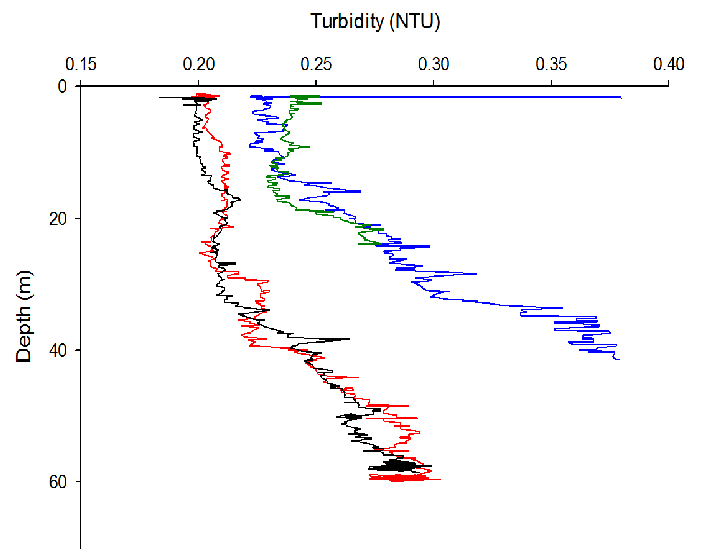
Figure 4. Turbidity depth profile across sample sites 55 – 58. There are two groupings seen in the data; the further offshore stations (55 and 56), and the near shore stations (57 and 58). The main difference between these two groupings is that the surface turbidity and turbidity at depth is higher for the near shore stations (57 and 58). Stations 55 and 56 have a surface turbidity of 0.2 NTU which stays fairly constant (increasing and decreasing) down to 40 metres depth where there is a noticeable increase to 0.275 NTU by 60 metres depth. In contrast, stations 57 and 58 start at a higher turbidity at the surface (0.225 and 0.24 respectively), staying relatively constant down to 20 metres where, again, there is a noticeable increase; station 57 increases to 0.375 NTU at 40 metres depth, whereas station 58 increases to 0.26 NTU (after a slight decrease between 15 – 18 metres) at 23 metres.
Results:
Sampled turbidity looks to have two groupings; stations 55 and 56, and stations 57 and 58. Stations 55 and 56 are those further away from the coastline. These stations have lower surface turbidity values (0.2 NTU) when compared to that of stations 57 and 58 (between 0.225 and 0.25 NTU) which were stations sampled closer to the coastline. Following the trend of the thermocline depth, turbidity at stations 55 and 56 does not increase significantly until about 40 meters depth, where it incre’ases from 0.225 NTU up to 0.275 NTU from 40 to 60 metres (up until 40 meters there are just random increases and decreases at each station). Compared to this at stations 57 and 58, turbidity starts to significantly increase at ~18 metres from 0.25 NTU (station 58) and 0.26 NTU (station 57) up to 0.275 NTU at 24 metres depth (station 58) and ~0.375 NTU at 38 metres depth (station 57).
Discussion:
The four stations sampled forming two distinct groupings can be explained by the distance away from the shore. Stations 55 and 56 forming the first grouping with a lower surface turbidity and lower turbidity values at depth are those furthest away from the shore. In contrast, stations 57 and 58 are those closer to the shore, and this grouping is seen to have a larger surface turbidity and turbidity values are larger with depth also. This is due to the fact that with increasing distance from the coastline, there is a reduced nutrient supply due to movement away from the high nutrient riverine inputs in estuarine system and therefore primary production is limited(Cloern, Foster, and Kleckner, 2014). This reduction in primary production subsequently results in a reduction of phytoplankton in the water column reducing the turbidity (Dieter, 1990). As for the increase in turbidity with depth, a unanimous trend across all stations, this is likely to be due to resuspension of benthic sediments through bottom currents.

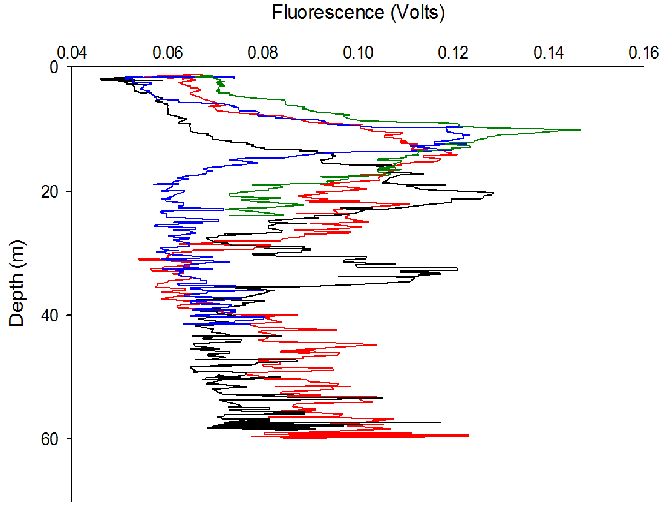
Figure 5. Levels of fluorescent emission changes with depth in the water column. At all stations, fluorescence is lowest in the surface waters, peaks in the intermediate water and proceeds to decline.
Results:
Station 55 and 56 were sampled when the water column was deeper; measures of fluorescence did not go as deep at stations 57 and 58. All four stations show low levels of fluorescence in the surface of the water column, with a peak in recorded fluorescence shown at intermediate depths. Measures of fluorescence decline rapidly over a short depth at station 57, whilst measures of fluorescence from station 56 display a much more varied pattern of decline with depth.
Discussion:
Fluorescent emission can be used as a proxy of chlorophyll concentration, the dataset displays a significant level of noise, making the interpretation of data difficult. There is, however, a notable peak in fluorescence at approximately 15 m depth at station 58; this corresponds with the depth of station 58 thermocline shown in Figure 5 meaning that the peak in fluorescence is likely to have resulted from the presence of increased concentrations of phytoplankton, and therefore chlorphyll pigments, at this temporal boundry layer (Holligan and Harbour, 1977).

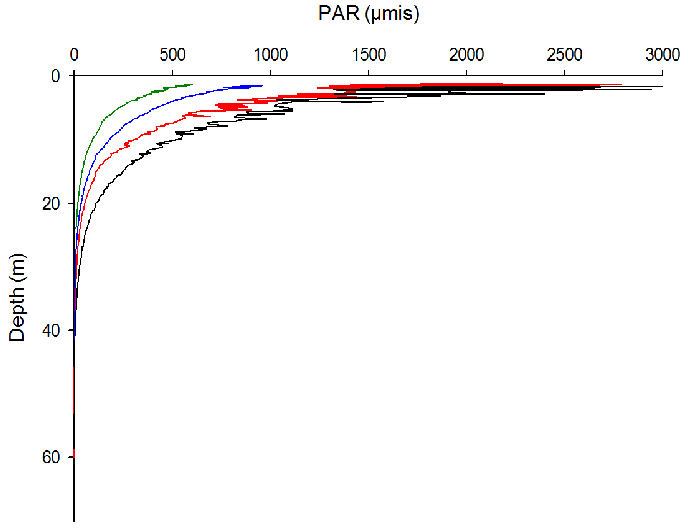
Figure 6. PAR quantifies the spectral range within which organisms use light to photosynthesise. All four stations examined show exponential decrease in Photosynthetically Active Radiation (PAR) with depth. Surface values of photosynthetically active radiation are massively reduced in the transition between stations 56, and 57; PAR at stations 55 and 56 was far greater than that of stations 57 and 58. No light was able to penetrate through the water column beyond depths of approximately 40 m.
Results:
All four of the sampling stations show a significant amount of curvature. Stations 55 and 56 experienced the greatest levels of PAR; the level of irradiance reaching the surface of the sea was highest at station 56, with a value of 2041 μis. Station 55 had the next greatest level of PAR; whilst station 58 experienced the most reduced amount of PAR. All decline in values was exponential.
Discussion:
Datasets collected from all four sampling stations show a considerable degree of curvature, revealing photosynthetically active radiation (PAR) to decrease exponentially with depth. The depth to which light penetrates can be attributed to a number of environmental variables; quite often, water level and incident irradiance are described to impact the depth to which PAR can be detected [Schwarz et al, 2000]. The further down the PAR can penetrate, the greater the phytoplankton community is likely to be. PAR at stations 55 and 56 was much greater than that at 57 and 58. This is likely to be due to the increased turbidity present in the water column evident in figure 4.


Phosphate
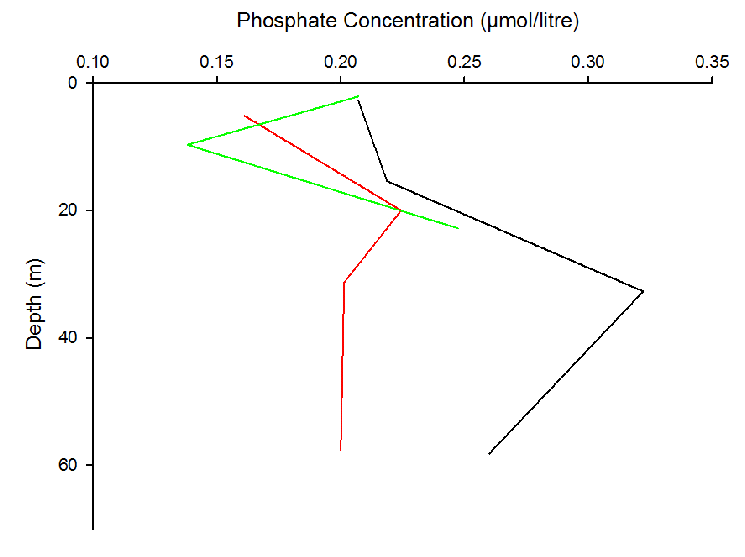
Figure 7. The relationship between the concentration of phosphate (µmol/litre) and depth (m) at each of the three stations sampled aboard R.V. Callista.
Results:
All stations exhibit an overall increase in phosphate concentration from the surface to the deepest depth (approximately 58 m). Station 55 displays the highest surface phosphate concentration, whereas station 56 shows the lowest. Similarly, station 56 indicates the overall lowest concentration of phosphate, showing the lowest recording at the deepest depth sampled. Meanwhile, station 55 shows the highest recordings of phosphate concentration for both the surface and the deepest measurements, whilst station 55 displays the highest peak in the concentration (approximately 0.325 µmol/litre). Conversely, station 58 shows the largest peak towards the lowest values, therefore reaching the lowest overall reading at 10 m (~ 0.126 µmol/litre).
Discussion:
The overall increase in phosphate concentration with depth is indicative of the utilisation of the nutrient at the surface. As phytoplankton are photosynthetic organisms, they remain within the euphotic zone and surface waters where irradiance is greatest. Therefore, phytoplankton and other organisms (i.e. zooplankton) do not dwell at depths, meaning that less phosphates will be used for the production of cellular components (e.g. phospholipids, DNA and other genetic material). The use of this nutrient is displayed best by station 58, as the concentration of phosphate rapidly declines within the surface waters. Additionally, the greater concentration of phosphates at depth is likely due to the remineralisation of dead cells (e.g. phytoplankton) and resuspension of phosphates from the benthic sediment.
Nitrate
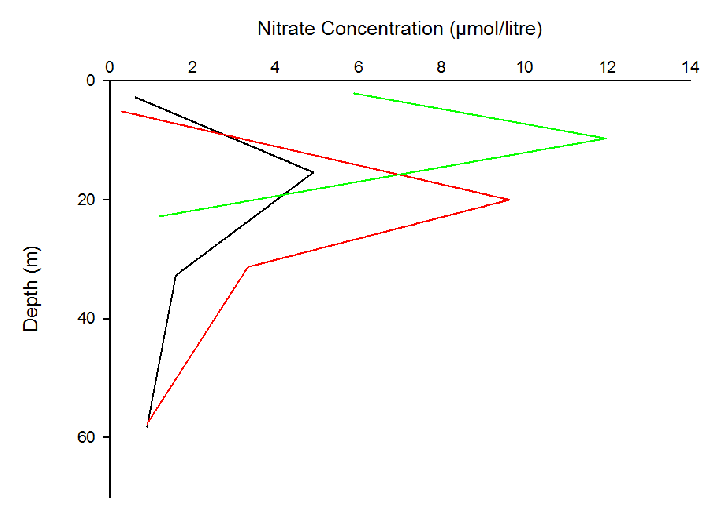
Figure 8. Variations in the concentration of nitrate with depth at each of the three stations sampled in Falmouth Bay. All three stations exhibit a peak in nitrate concentration at intermediate depths; before suffering decline with increased depth.
Results:
The lowest concentration of nitrate occurs in surface waters before experiencing a peak in concentrations at intermediate depths. Stations 55 and 56 have very similar surface water nitrate concentrations (0.5 µmol/l) but station 58 has a much greater surface value of 6 µmol/l. All three stations surveyed display an increase in nitrate as depth increases; station 56 peaks the deepest depth of 25 m, whilst station 58 sees nitrate concentrations peak at the most shallow depth of 10 m. In addition to having a similar value for surface water nitrate concentrations, stations 55 and 56 also share a similar concentration of nitrate at their deepest recorded depth. The profile at station 58 varies slightly from that of the other stations.
Discussion:
Nitrate is a vital macronutrient that is incorporated into structures such as DNA
in living organisms. Surface concentrations of nitrate of are likely reduced as there
is a greater abundance of phytoplanktonic organisms occupying the sun-
Silicate
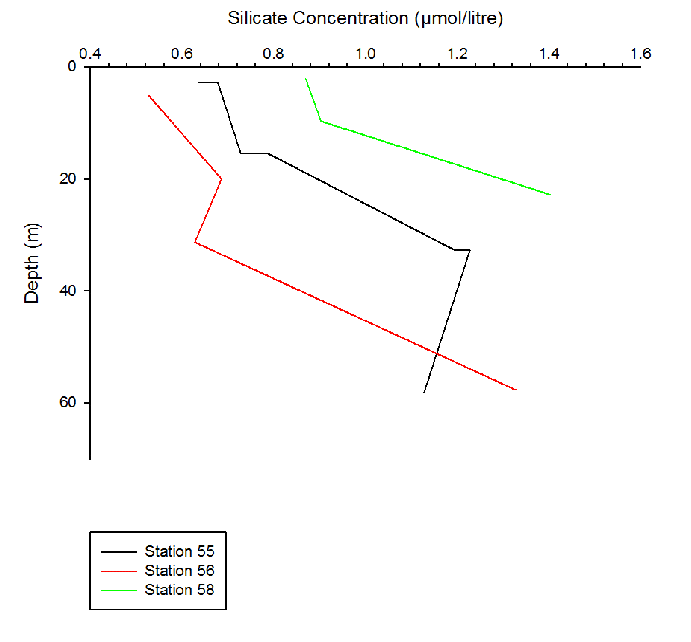
Figure 9. The variation in dissolved silicon concentration (µmol/litre) with depth at three different stations offshore of the Fal Estuary, taken with a CTD rosette with six attached Niskin Bottles on board the R.V. Callista.
Results:
At all three stations the concentration of silicon increases with depth. The highest concentrations of silicon were closest to the estuary, at station 58. However, the lowest concentrations were found at station 56, which was between 55 and 58, and was not the furthest offshore. The depths sampled at each station were different, and only three points were taken for station 58 due to the shallow water depth.
Discussion:
The variation with depth can be attributed to the uptake of silicate by siliceous phytoplankton at the surface of the ocean. As light is attenuated with depth, the abundance of phytoplankton that require silicate decreases, allowing concentrations of silicate to increase. However, the increase at depth could also be attributed to remineralisation of silicate or resuspension from the benthos. The change in concentration at each station can be attributed to increased amounts of silicate being carried out to sea by the estuary. As silicate flocculates at increased salinities, it follows that at the stations further offshore the silicon concentrations would be lower. However, the increased concentrations at station 55 – which was further offshore than station 56 – could be attributed to an offshore phytoplankton bloom or different water masses interacting. The profile taken at station 58 is less accurate than the others, as due to the shallower depth at the sample site, only three samples could be taken, compared to four for the other stations.

Zooplankton
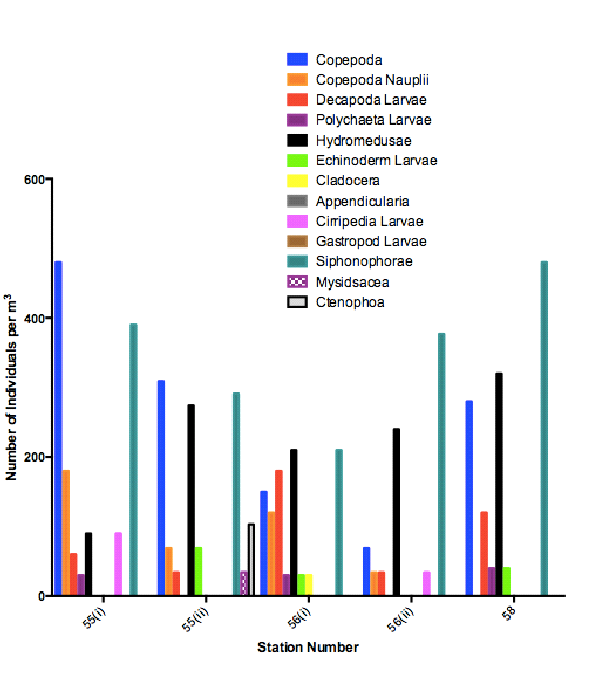
Figure 10. Samples of zooplankton taken from stations 55, 56 and 58 offshore and the number of species present per m2. Stations 55 and 56 are split into (i) and (ii). Samples at stations 55(i) and 56(i) were taken between 16 metres depth and the surface. Samples at 55(ii) and 56(ii) were taken between 30 metres and 16 metres depth. Station 58 was sampled between 12 metres and the surface. It can be deduced which species are dominant at stations 55(i), 55(ii), 56(i), 56(ii) and 58 (Copepoda, Copepoda, Hydromedusea/Siphonphorea, Siphonophorae and Siphonophorae respectively).
Results:
At station 55(i) the most dominant species, Copepoda, are present at 480 individuals per m2, and at 180 per m2 at station55(ii). Hydromedusea at station 56(i) are at 660 individuals per m2 and at station 56(ii) Siphonophorae are present at 377 per m2. Lastly at station 58, the same species is present at 480 individuals per m2. There are a few species present at only one station in some cases; Ctenophora are present only at station 55(ii) with 103 individuals per m2. Mysidacea are also only present at station 55(ii) at 34 per m2. Cladocera are only present at station 56(i), at 30 individuals per m2. Lastly, Hydromedusae are the most dominant species overall across all stations and all depths (at a total of 1584) when individuals per m2 values are summed.
Discussion:
Mixing and nutrient flux to the photic zone is the main control on the strength and amount of primary production, which dictates the amount of energy entering the ecosystem, driving composition of the Zooplankton communities (Coyle et al., 2008). Furthermore, the dominant regulator of the phytoplankton blooms is the increase in irradiance and temperature which comes with changing of the seasons from winter to spring then summer, and thus the mixing depth shoaling to above the critical depth (Siegel et al., 2002). These annual variabilities are thought to be the main control of dictating which zooplankton species are present and to what intensity, providing evidence for the species observed at the sampling stations at this time of year. At stations 55(i) and (ii) sampled, the dominant species was the same (Copepoda) thus it can be assumed that there may be little difference of species present here at depth and at the surface. However, there are species present at the surface at this station which aren’t present at depth (Cirripedia larvae). This could be down to other factors, though; It is well known that Diel Vertical Migration is undertaken by many Zooplankton species. Distributions may well vary with time of day regarding these daily vertical movements so in order to solidify the idea that this may be a contributing factor to the distributions, more samples would have to have been taken at the same site and depths, but at varying times throughout the day.
References:
Coyle, K. O., Pinchuk, A. I., Eisner, L. B., & Napp, J. M. (2008). ‘Zooplankton species
composition, abundance and biomass on the eastern Bering Sea shelf during summer:
The potential role of water-
Dieter, C.D. (1990) ‘Causes and effects of water turbidity : a selected annotated
bibliography’. Review of by Cloern, J.E., Foster, S.Q. and Kleckner, A.E. (2014)
‘Phytoplankton primary production in the world’s estuarine-
Holligan, P.M. and Harbour, D.S. (1977) ‘The vertical distribution and succession of phytoplankton in the western English channel in 1975 and 1976’, Journal of the Marine Biological Association of the United Kingdom, 57(04), p. 1075. doi: 10.1017/s002531540002614x.
Millero, F. J., Gonzalez, A., & Ward, G. K., 1976. ‘Density of seawater solutions
at one atmosphere as a function of temperature and salinity’. Journal of Marine Research,
34(1), pp. 61-
NOAA (2015). ‘What is a Thermocline?’. Available at: http://oceanservice.noaa.gov/facts/thermocline.html (Accessed: 30th June, 2016).
Schwarz, A-
Siegel, D. a, Doney, S. C., & Yoder, J. a. (2002). The North Atlantic spring phytoplankton bloom and Sverdrup’s critical depth hypothesis. Science, 296(5568), pp. 730–733. http://doi.org/10.1126/science.1069174
The views and opinions expressed on this website are those of individuals within group 8 and are not associated with The National Oceanography Centre, University of Southampton or Falmouth Marine School.