
Stations
55: Black
56: Green
57: Purple
58: Yellow
Figure 2. A tidal chart used to show the state of the tide when each station was sampled. As with the study of the estuary, the first sample station (55) was measured as the tide began to move away from high tide. As sampling progressed, the water progressed further towards low tide with station 58 being sampled 1 hour and 37 minutes before the point of low tide.
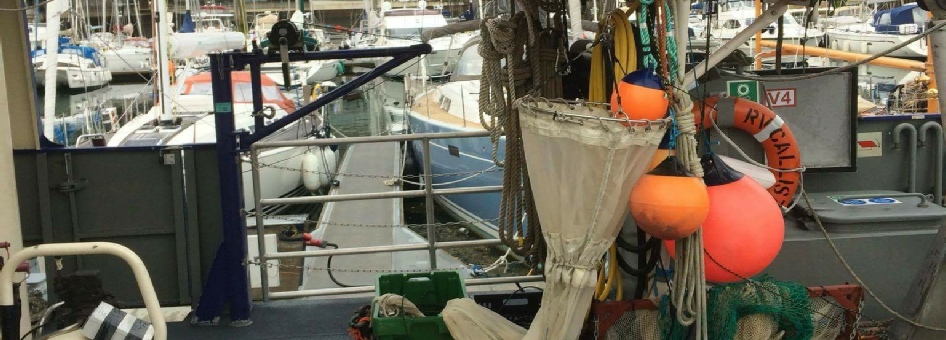
The transect was split into three stations with an additional profile taken using just the CTD at a point between the final two stations. At each station biological, physical and chemical parameters were measured. Physical data was collected by a CTD rosette and an ADCP, whereby both temporal and spatial transects were taken by the ADCP only. The CTD rosette also housed six functioning Niskin bottles, four of which were used to collect water samples from surface, intermediate and deep depths, deployed off the stern of the vessel. The water samples collected were used for subsequent analyses of chlorophyll, dissolved oxygen, silicates and phosphates. Additionally, a zooplankton sweep net (51.5 cm net diameter, 200 µm mesh size) was deployed at three stations to collect a plastic bottle of zooplankton for further analysis in the laboratory the following day with deployment twice at the first two stations and one final deployment at the most landward station. Lastly, a Secchi disk was deployed at each station and lowered over the starboard side of the vessel to give an approximation for the attenuation of light; all Secchi disk measures, however, are reliant on analysis by eye.
A survey was conducted on the 30th June 2016, aboard R.V. Callista in order to analyse the physical, biological and chemical changes along a transect starting at the offshore site B and progressing landward.

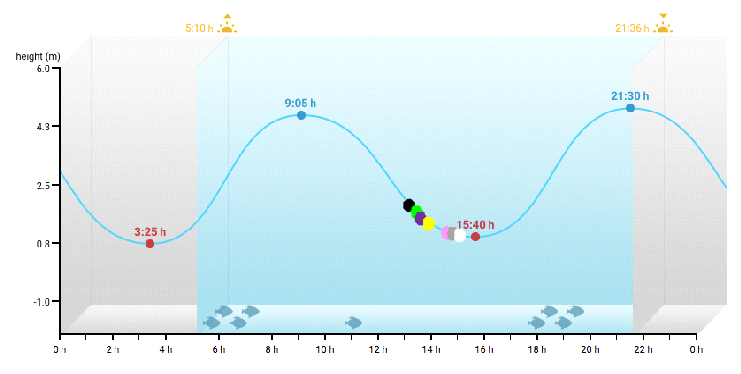
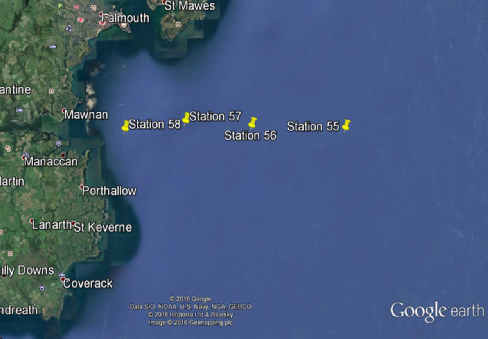
Figure 1. Map of offshore sampling route. Image courtesy of ©Google Earth.
OFFSHORE
30/06/16
The views and opinions expressed on this website are those of individuals within group 8 and are not associated with The National Oceanography Centre, University of Southampton or Falmouth Marine School.