


The water samples collected from the CTD rosette (as in method) were used in subsequent lab analysis of water samples to examine nutrient concentration. Samples were tested for nitrate, silicate and phosphate concentrations as well as the level of dissolved oxygen. A number of preparatory procedures were performed in the wet lab, including filtering and adding reagents, on board the R. V. Callista.
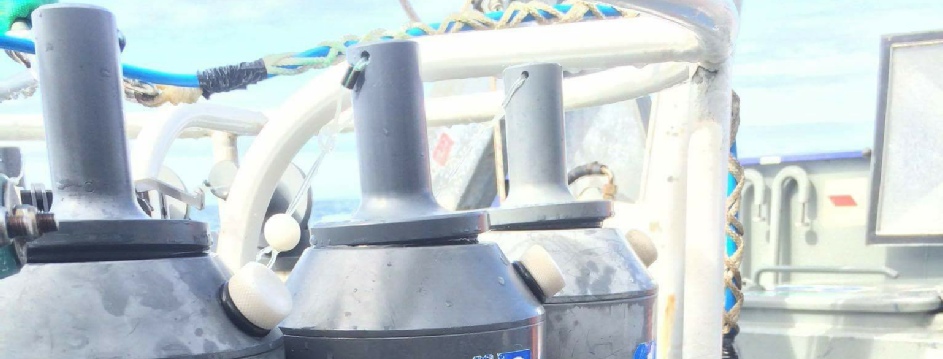
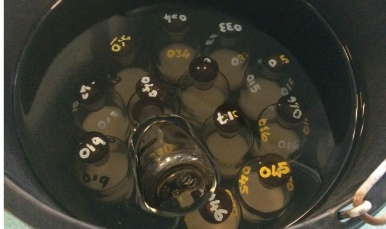
When obtaining a sample from the Niskin bottles, the sample bottle was inverted and then filled to the brim to ensure there was no air bubbles trapped in the sample. 1 ml of manganese chloride and alkali iodide was added to the sample producing a cloudy precipitate corresponding to the exact concentration of oxygen within the sample at the time of sampling. The sample bottle was then stored in a bucket of water to prevent any additional oxygen entering the sample. A total of 11 samples were obtained, 4 from the first two stations and 3 form the final station. Upon returning, the lab a titration with sodium thiosulphate was then carried out on each of the samples to determine the percentage dissolved oxygen in each of the sample bottles.


Nitrate
For analysis of all chemical consituents in water samples, filtering was carried out in the wet lab aboard the R. V Callista prior to any bottling of samples.
Each sample bottle was filled to the brim as there was no set volume to collect for each sample. In total, 11 sample were collected from each Niskin bottle, which were preserved with mercuric chloride and stored for 24 hours. To determine the concentration of the samples, a number of known standards were mixed with reagents using a flow injection process, this generated a product that experienced absorbance under light of wavelength 540nm in a 35ml cell.
The absorbance outputs were calculated using a spectrometer and recorded using a chart recorder with two replicates carried out for each standard. The same process was replicated for each one of the 11 water samples collected aboard the R. V Callista using the Niskin bottles. The absorbance values recorded for each of the samples were then used to calculate nitrate concentrations within these samples through comparison to a calibration curve, which was plotted using the absorbance values of the measured standards.
Phosphate
As with nitrate, each sample bottle was filled to the neck as there was no set volume of sample that needed to be preserved in each bottle. All samples were preserved with mercuric chloride and stored for 24 hours. Replicate measures were taken every fifth sample and the concentration of phosphate measured at various depths at each of the stations was calculated. 30 ml of water was extracted from each sample collected from the offshore survey. Phosphate standards were made up and used as a comparator for the absorbance of samples collected.
After a period of incubation, each sample was transferred into a 10 cm cell and placed into a spectrometer. This allowed for the level of absorbance and consequently the concentration of phosphate to be calculated using the calibration curve produced by the absorbance values from the standards.
Silicate
As with previous samples, there was no set volume of water that needed to be sampled, and thus the bottles were just filled to the neck. The samples were poisoned with mercuric chloride and stored for 24 hours before analysis in the dry lab.
The mixed reducing reagent (MRR) was then prepared, using proportions of metol-

- For phosphate, there were no problems with the lab analysis. However, for the silicate, the full two hours for the mixed reaction reagents to react with the silicate in the sample was not completed, and they were analysed after only an hour and a half, which could have had an effect on the observed absorbance. For the nitrate, the method was followed but due to time constraints replicates could not be done for every sample, so it was only done for the first 4 samples.
The views and opinions expressed on this website are those of individuals within group 8 and are not associated with The National Oceanography Centre, University of Southampton or Falmouth Marine School.