


Samples were taken from the surface Niskin bottle on the CTD rosette. 100ml of sea water was measured out and transferred into the glass bottle (acetone was already present in each bottle). Each bottle was then stored for later analysis. Samples were taken at every station, except F20, the penultimate station.
Following preservation of surface water phytoplankton in Lugols solution, samples
were placed into a Sedgewick-
Having done three deployments of the zooplankton net and collected samples of phytoplankton from the Niskin bottles; the samples were then analysed. The samples were looked at under microscopes, and the organisms found were noted and tallied.
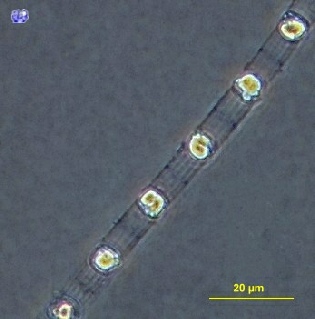
The organism that occurred most commonly was Skeletonima, whilst the number of individuals sampled from each site varied from 10s of phytoplankton to over 150. Station A14 was located in the innermost part of the Fal estuary and concentrations of phytoplankton were higher than station G21, which was in close proximity to Blackrock.
Figure 1. Skeletonema with a scale bar for size reference. Image courtesy of planktonnet.awi.de. Available from: https://planktonnet.awi.de/index.php?Contenttype=im age_details&itemid=55195 [Accessed 01/07/16].
On Bill Conway, zooplankton samples were taken for lab analysis. Firstly, a net (200 mm mesh size/50cm diameter opening) was dragged behind the Bill Conway for ~5 minutes. The net had a propeller attached where the number of revolutions were counted. On the bottom of the net was a bottle for collection of the water with zooplankton inside. This was transferred to another, separate numbered bottle for each of the 3 stations where zooplankton were collected down the estuary. These bottles were frozen overnight for lab analysis.
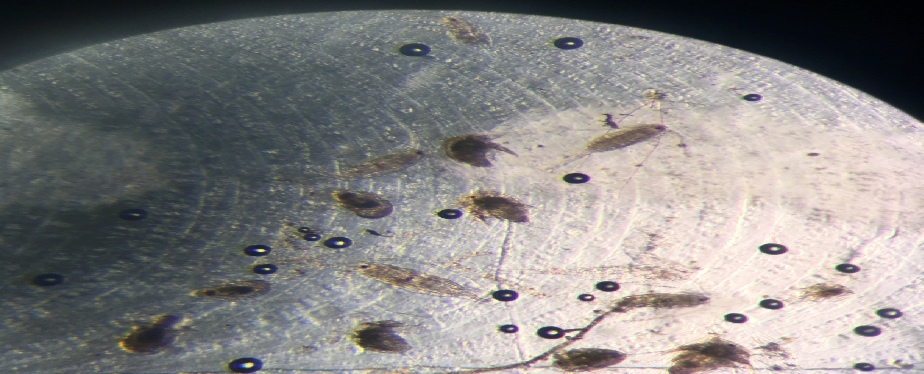
Analysis took place in the lab. Each bottle had 10 ml of water taken – 5 ml of this was placed under a microscope at a time and the number of each type of zooplankton were identified, counted and tallied. Thus the tally of the amount of each type of zooplankton were deduced, per 10 ml of sample water (for each station sampled). This data was used, along with the amount of propeller revolutions, to deduce the amount of zooplankton individuals per m3. This was done for each of the 3 stations sampled down the estuary.
The most common zooplankton were copepods, and the numbers at each site varied from only a few individuals to over 300.
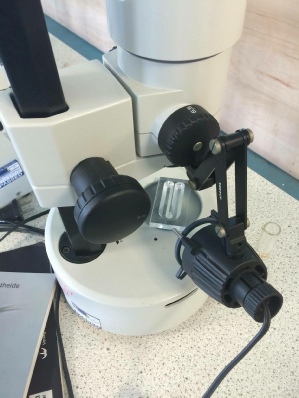
Figure 2. Microscope used during zooplankton identification
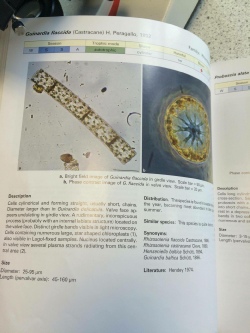
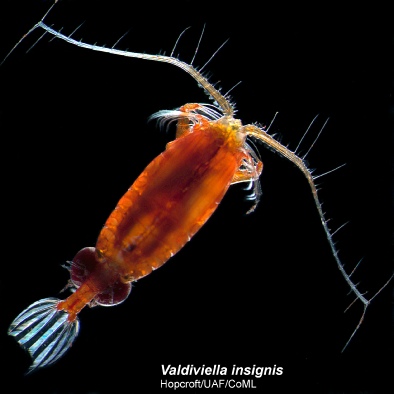
Figure 3. Common copepod V. insignis. Image courtesy of The Copepod Project. Available from: https://www.st.nmfs.noaa.gov/copepod/about/index.html


The views and opinions expressed on this website are those of individuals within group 8 and are not associated with The National Oceanography Centre, University of Southampton or Falmouth Marine School.