


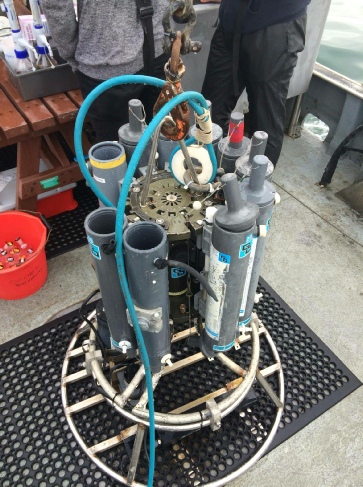
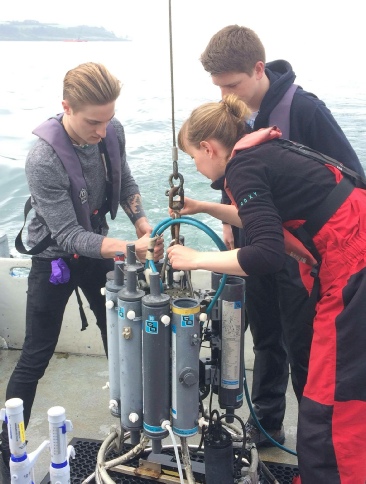
In order to obtain results for various physical, chemical and biological parameters, a CTD Rosette consisting of 7 Niskin Bottles and a further probe for temperature and salinity was used. 6 of the Niskin Bottles were for primary usage with one spare in case of any mechanical or electrical faults occurring with the bottles (Figure 1). There were 2 bottles for taking water samples at each chosen depth, from the surface, the intermediate and bottom of the water column.
The rosette was carefully winched off the stern of the Bill Conway deck and first
placed into the surface of the water column to begin obtaining measurements for our
survey. Using the on-
Bottle deployment was verified by those at the stern, and the rosette was raised
back on deck. On a few occasions there was an issue with the bottle at the surface,
so the spare Niskin bottle was used to obtain those water samples. Once on deck at
each station, water was emptied from the bottles through their taps to the respective
plastic bottles for deep, middle and surface depths, handed over for biological pre-
Overview:
For measurements of the current flow, and volume transport, an Acoustic Doppler Current Profiler (ADCP) was switched on upon arrival at the station and off, when leaving the station, to obtain a time series measurement, using temporal transect data on the ADCP software. After we left the station, a spatial transect was taken of the river running from each side of the river and over the respective sites. The software was set up so the visual image of the transect was looking up the relative rivers and the Fal Estuary. The data from the software was then analysed, taking various measurements from both spatial and temporal transects.


Figure 1. A CTD rosette equipped with 7 Niskin bottles (6 functional and 1 reserve) and a temperature/salinity (T/S) probe.
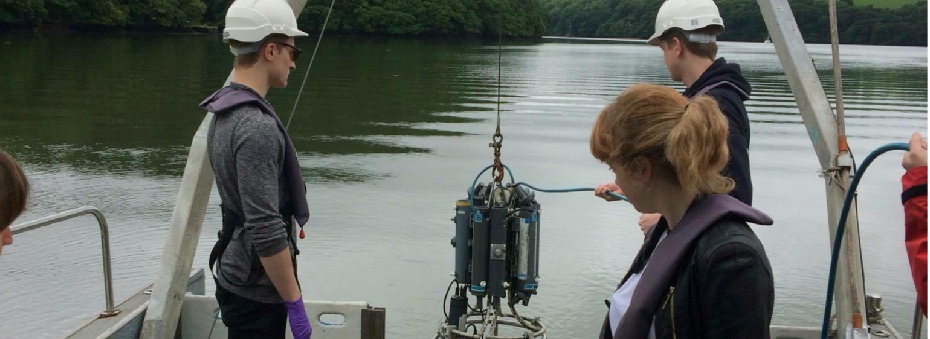
Figure 2. Group 8 deck hands deploying the CTD at station A14.
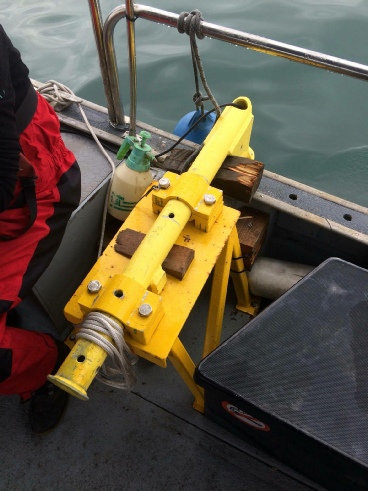
Figure 3. Plan view of the ADCP aboard R.V. Bill Conway.
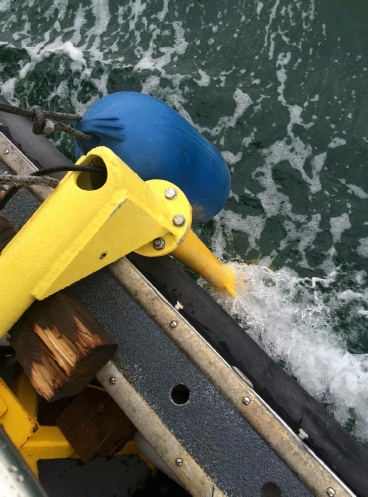
Figure 4. ADCP aboard R.V. Bill Conway submerged in the surrounding water.
Overview:
Temperature and salinity were recorded on board by a build in T/S probe, with recordings taken every five minutes throughout the duration of sampling at each station.


Overview:
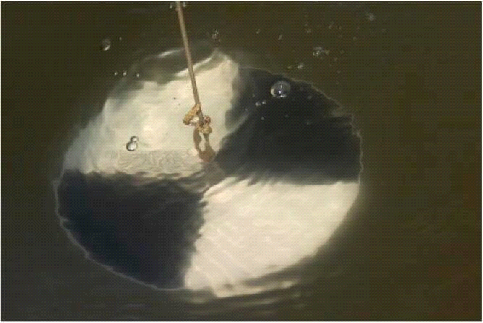
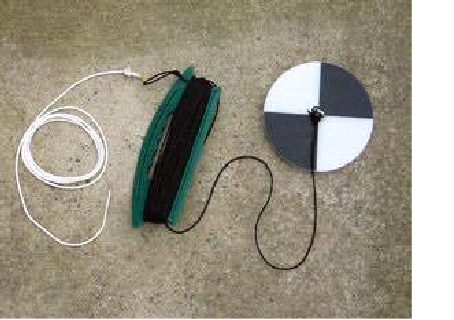
To get a good estimate of the maximum light penetration in the survey, a Secchi Disk was lowered off the starboard side of Bill Conway at each station. The rope had been marked every metre, to indicate a depth measurement, and was placed into the water with an anchor weight to allow the Secchi Disk to sink. At some of the stations the boat wasn’t moored, which on top of the flow, meant that the rope wasn’t completely vertical in the water. This could have had a minor effect on the accuracy of results. Once the Secchi Disk had disappeared from view, a further measurement was taken for the exact depth using a tape measure between the surface and the height above, which was subtracted from the depth measurement taken for the real reading. Deciding on the disappearance of the disk was subject to human perception.
- Temporal plot (G21) – started moving towards the end of a reading, before it was switched off (shouldn’t make a difference to the data), but need to be aware that it happened.
- Secchi Disc-
The obvious subjective issue; people have different eyesight and have to estimate where the water came up to on the rope. - CTD Rosette-
Issues with Niskin bottle exchange with seawater? (perhaps not rapid enough exchange) plus misfires which would mean only one bottle fires rather than two, or they may have fired at a non- desirable depth. Also one bottle broke half way through so had to miscount this sample - T/S probe & handheld-
There were calibration issues between the two probes – unsure which is more accurate.

The views and opinions expressed on this website are those of individuals within group 8 and are not associated with The National Oceanography Centre, University of Southampton or Falmouth Marine School.