


After having used the Niskin bottle to collect various water samples throughout the Fal estuary, lab analysis was used to examine both the nutrient concentration of the samples from surface waters. Samples were tested for nitrate, silicate and phosphate concentrations as well as the level of dissolved oxygen.


After each recovery of the CTD rosette, one water sample was collected from the Niskin bottle which sampled from the surface of the water column. The sample was then placed into one numbered glass bottle, with 1ml each of manganese chloride and alkali iodide. The sample bottle was then stored in a bucket of water to prevent any additional oxygen entering the sample. Seven samples in total were taken, one at each station (Figure 1).
Six of the seven samples had the incorrect amount of reagent added (Figure 2), so they could not be analysed. Only station seven (bottle number 70) was preserved properly, and it was analyse using a titration of sodium thiosulphate with a concentration of 0.22 mol. A light meter was used to determine how much sodium thiosulphate had to be added to make the solution completely clear (Figure 3), and the final amount of reagent needed was 19.975 ml. From that, the percentage dissolved oxygen could be calculated.
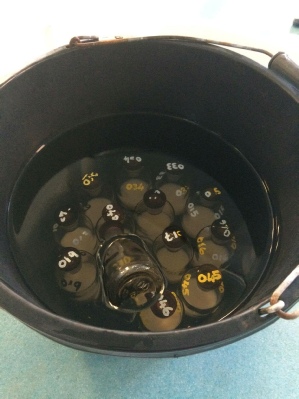
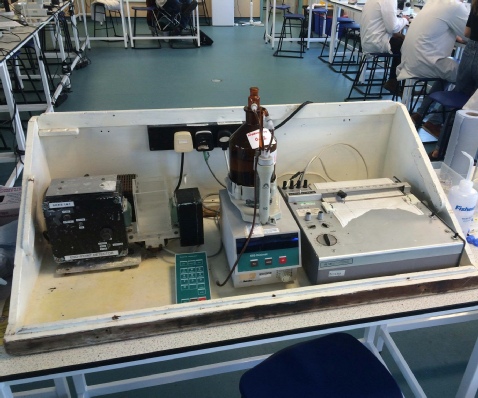
Figure 1. Dissolved oxygen sample bottles stored in a bucket of cold water aboard R.V. Bill Conway prior to lab analysis.
Figure 2. Managanese chloride and alkali iodide in separate dispensers aboard R.V. Bill Conway, to aid in the preparation and preservation of dissolved oxygen samples.

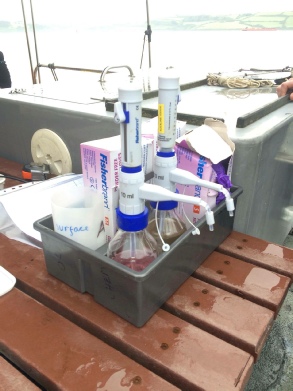
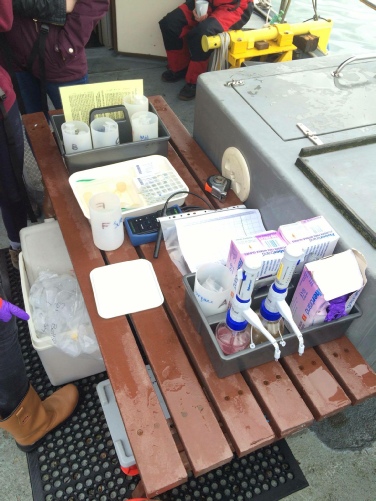
Figure 3. Equipment setup for calculating dissolved oxygen. Titration carried out with sulphuric acid into a large glass brown bottle. An attached light meter determined when the sample became completely clear, then a chart recorder would print out readings when the sample became clear.

A 50ml plastic syringe was filled with the water sample, and a filter was attached
to the end. The sample was then filtered into a brown glass bottle for nitrate analysis.
There was no set volume of sample which needed to go into each bottle, therefore
each bottle was filled up to the neck. This process was repeated two more times for
the other two water samples from the Niskin bottles (surface, middle and deep). After
the survey, all samples were preserved with mercuric chloride and stored for 24 hours.
A total of 21 samples were taken back to lab for analysis of nitrate concentrations
n, consisting of 3 samples at varying depths from each of the 7 sites (A-
In order to determine the concentration of the samples a number of known standards were mixed with reagents using a flow injection process (Figure 4). This generated a product that experienced absorbance under light of wavelength 540nm in a 35ml cell. These absorbance outputs were calculated using a spectrometer and recorded using a chart recorder with two replicates carried out for each standard. The same twice replicated process was carried out for each one of the 21 water samples collected aboard Conway using Niskin bottles. The absorbance values from this range of samples were then used to calculate the concentration of nitrate in each sample through comparison to a calibration curve, which was plotted using the absorbance values for the standards. The final concentrations for each of the water samples were plotted on an estuarine mixing diagram including a theoretical dilution line between the endmembers to interpret mixing properties of the estuary, here with respect to nitrate.

Nitrate

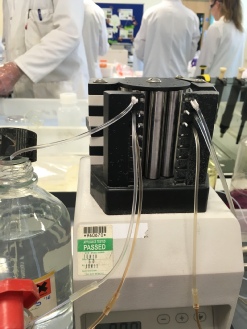
Figure 4. Flow injection of the filtered nitrate samples from the estuary into a capillary tube that then combines with the other reagents in the reaction.
Figure 5. A number of capillary tubes containing the reagents used in the nitrate analysis. The contents of the tube are kept in motion by the apparatus shown here.
Phosphate
A 50ml plastic syringe was filled with the water sample, and a filter was attached to the end. The sample was then filtered into a brown glass bottle for later phosphate analysis. There was no set volume of sample which needed to go into each bottle, therefore each bottle was filled up to the neck. This process was repeated two more times for the other two water samples from the Niskin bottles (surface, middle and deep). After the survey, all samples were preserved with mercuric chloride and stored for 24 hours.
With replicate measures taken every fifth sample, the concentration of phosphate measured at various depths at each of the stations was calculated. 30 ml of water was extracted from each sample that had been collected from the survey of the Fal estuary. Phosphate standards were made up and used as a comparator for the absorbance of samples collected.
After a period of incubation, each sample was transferred into a 10cm cell and placed into a spectrometer. This allowed for the level of absorbance and consequently the concentration of phosphate to be calculated.
Silicate
On the boat, a 50ml plastic syringe was filled with the water sample, and a filter was attached to the end. The sample was then filtered into a plastic bottle for silicate measurements. There was no set volume of water which needed to be sampled, thus the bottles were just filled up to the neck. The samples were poisoned with mercuric chloride and stored for 24 hours before analysis in the lab.
First, 15 silicon standard tubes were made, where three tubes were filled with 15 ml of MQ water to create the blank standards. Replicates of each of 6 tubes contain increasing concentrations of silicon (0.46, 0.93, 1.40, 2.80, 7.10 and 9.30 mmol/L) made by adding 5, 10, 15, 30, 75 and 100 ml of working silicon standard solution respectively to the three tubes containing 15ml of MQ water. Next, 6ml of ammonium molybdate solution was added to each, and left for 10 minutes. 15 ml of each collected water sample from the survey were added to the tubes (where, every 5th bottle a replicate was made).
The river water endmember samples (bottles 500 and 501) were diluted by 10 times
due to the large silicon concentrations present, therefore they would not be able
to be analysed by the spectrophotometer. 6 ml of ammonium molybdate was also added
to all field samples and left for a further 10 minutes. The mixed reducing reagent
(MRR) was then prepared, using proportions of metol-
A 10 cm cell was filled with each standard/sample, and one by one placed into the spectrophotometer, where the absorbance was measured and recorded (higher value means more absorbance/more silicon). From this data, a silicon standards chart was made, along with an estuarine mixing diagram. The two river water endmembers were left for analysis last to prevent skews in the dataset (due to the extremely high silicon concentrations).
- Dissolved Oxygen-
Of all the samples taken, Bottle 70 contained the only successful sample. The bottle contained 120.6ml of sample and required 19.975 ml of sodium thiosulphate to titrate it. The results collected for dissolved oxygen were limited in two main ways; firstly, the Manganese chloride dispenser used in RV Bill Conway’s wet- lab was not dispensing reagents correctly. The was also an issue in sample storage whilst on- board Bill Conway; bottles were not sealed correctly meaning that when stored in a bucket of cold water, the sample mixed with the water causing for values to change. DO reagents: Manganese chloride, alkaline iodide Sodium thiosulphate conc = 0.22 Bottle 70 was the only one with data (120.6 ml of liquid; sodium thiosulphate required to titrate = 19.975 ml)or with the reagent (water may have seeped in during storage). One chemical on the boat did not dispense properly. - Chemical-
Storage – concentrations may be inaccurate (increased or decreased in storage). Filters may have not been applied onto the syringe properly, perhaps two rather than one or not exactly over the place where it should be, meaning that some unfiltered sea water may have entered the bottle (eg. Biological organisms or debris which may have had an effect on the nutrient concentrations in the sample). Filters could also have been contaminated by handling.


The views and opinions expressed on this website are those of individuals within group 8 and are not associated with The National Oceanography Centre, University of Southampton or Falmouth Marine School.