

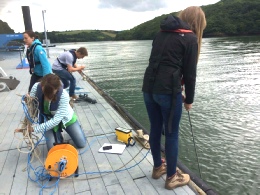
A time series was taken on the King Harry Ferry Pontoon, which is located midway up the Fal estuary. The purpose of the time series was to measure both physical and bio-chemical parameters over a 3 hour time scale, taking measurements every 30 minutes. The aim was to investigate how these parameters varied over a micro time scale.
The pontoon acts as a bridging point for ferries and other vessels passing through, and is subject to the flux changes characteristic of an estuary. Measurements were conducted on an ebb tide, starting just after high water. Four stations were used to measure different variables; a current meter (Fish-F66A) measuring flow speed and direction; an Exosonde probe to measure salinity, temperature, dissolved oxygen and pH; a light meter to measure irradiance at the surface and at depth; and a Niskin Bottle to acquire chlorophyll concentration samples at different depths. Various factors can effect these parameters such as the state of the tide, time of year, weather and boat activity.
It was expected that the temperature should decrease and salinity increase with depth since the denser saline water lies underneath the fresh water, although the water column should be well mixed due to the high tide. Flow is expected to increase with time from high water, since the slack at high tide will cause a lower flow rate and the flow rate will increase as the tide goes out. Light irradiance is expected to be greater at the surface since light attenuates exponentially with depth, meaning the chlorophyll concentrations and dissolved oxygen are also expected to be greater at the surface at each time interval, due to higher photosynthesis rates. Each parameter was measured against varying depths to give a vertical profile.

Metadata
Date: 24/06/2016
Time: 08:40 -11:10 UTC
Location: 50°12.976N 005°01.661W
Weather: 7/8 octants cloud cover, varying sunshine and light rain, light wind
Water Depth: 5-6.1m
Tide: High water 08:34 UTC; Low water 15:00 UTC
Each parameter was measured against varying depths to give a vertical profile. The Exosonde was used to accurately measure the depth by lowering the probe and waiting for the line to go slack. From this, the maximum depth was deduced to be 6.1 m, leading to the decision that measurements should be taken at 1 m intervals from the surface to 5 m. Measurements at each station were taken every 30 minutes, starting at 08:40 UTC and finishing at 11:10 UTC, however boat traffic and ferries had to be accounted for, which led to variation within starting times at each station.
The filter papers obtained from the Niskin bottle samples were stored in acetone and refrigerated for 24 hours, before being placed in a fluorometer to measure the concentration of chlorophyll (µg/L). These values were corrected via the following calculation:
(volume of acetone (6ml) / volume of seawater (50ml) × reading.
All other parameters were measured in situ at the stations. Salinity values had to be corrected by subtracting 12 psu off each reading from the Exosonde, since the instrument was incorrectly calibrated, and irradiance values were calibrated via the surface light sensor on the pontoon, to account for varying cloud cover.
Niskin Bottle
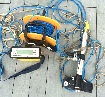
Light meter
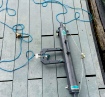
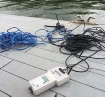
Flow meter
Measuring the irradiance at discrete depths at half hour intervals.
Flow speed (m/s) and direction (deg. from North) measurements were taken using FISH-F66A that was lowered through the water column.
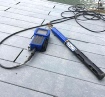
Exosonde
A measure of salinity, depth, temperature, percentage saturation of oxygen and pH.
Collection of water samples at discrete depths, in this case used to analyse chlorophyll.
| Physics |
| Chemistry |
| Biology |
| Niskin |
| Flow meter |
| Light meter |
| Exosonde |
| Discussion |
| Physics |
| Chemistry |
| Biology |