

Aim: To gather survey data to create a detailed benthic habitat map of the SAC boundary near Zone Point.
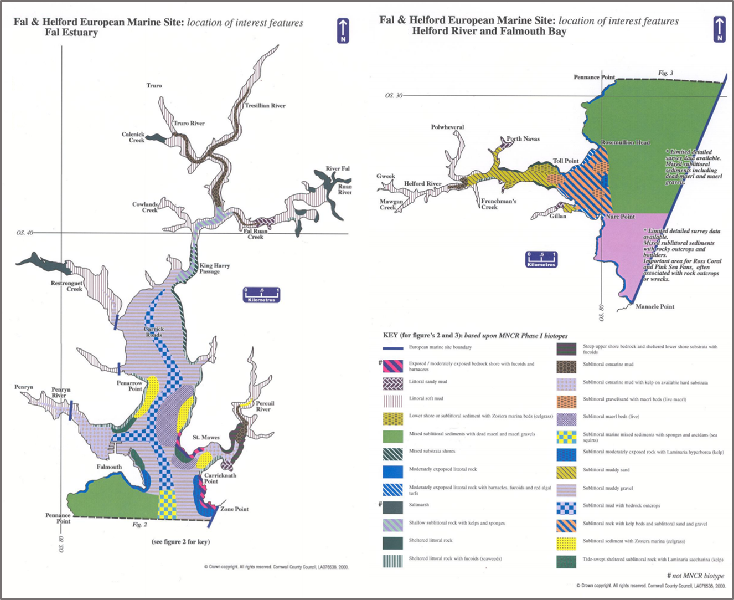
The Fal estuary is located in Cornwall in the south-west of England. It is a Special Area of Conservation (SAC), designated as such in 2005 due to qualifying features including: estuaries, mudflats and sandflats not covered by seawater at low tide, large shallow inlets and bays, reefs, sandbanks which are slightly covered by seawater all the time, and shore dock (Rumex rupestris) [4]. The qualifying features also included the presence of live maerl and seagrass beds. The Fal estuary SAC encompasses the two drowned river valleys of the Fal Estuary and the Helford River and the inner part of Falmouth Bay between Zone Point and Manacle Point [5].
A survey was conducted on June 22nd 2016 between 08:14 and 10:18 UTC and Zone Point was chosen as our survey location because it crossed the SAC boundary. There was 6/8 cloud cover with a sea state of 1 and calm wind conditions. High water was at 06:19 UTC and low water at 12:44 UTC, meaning an ebb tide was expected whilst undertaking the survey.
Click to enlarge
As Zone Point was a headland with observable intertidal rocky substrates, the type of substrate could be predicted in the area that being surveyed. The Natural 2000 would define this area as a reef [5]. This means that it was expected that leafy seaweeds such as kelps would be seen, which dominate in shallow waters, and also encrusting animals such as anemones, sponges and hydroids, if the area was deep enough. It was also expected that species such as the pink seafan, which would indicate a healthy reef structure, would be observed. Due to the expected dominance of leafy seaweeds such as kelps, a higher diversity of organisms was expected due to the high productivity and species richness associated with leafy seaweeds such as kelp. [5]
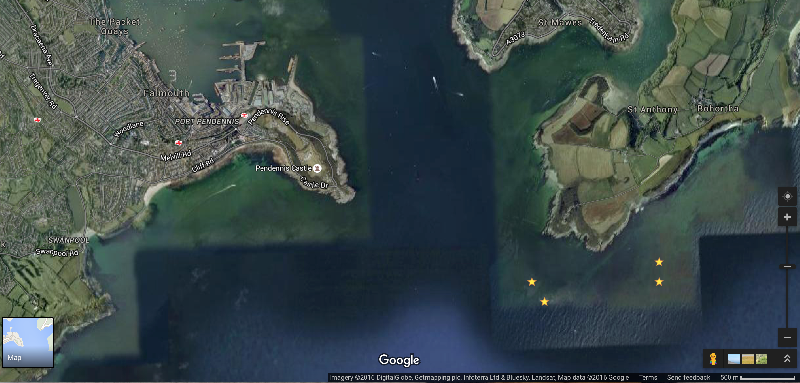
Zone Point (50°08.236N, 005°01.042W) was chosen as the survey location because the conditions were mild and fairly calm (Beaufort wind scale 1 and sea state 1), so the vessel was able to go further offshore than it normally would be able to, allowing us to survey the mouth of the estuary. Surveying Zone Point also allows us look at differences either side of the SAC boundary line at Zone Point.
A sidescan sonar survey was undertaken by taking 4 transects across the SAC boundary line using a TowFish surveyor which had been deployed from MTS Xplorer. The TowFish was lowered to a depth of 1m and had a swath width of 150m. Transect lines were 2km long and spaced 100m apart allowing overlapping to occur ensuring that there were no areas on the seafloor missed in our survey area.
During the sidescan survey, the receiving computer monitor was observed to select points of interests to then investigate with the video camera. Once a point of interest was identified, we noted it down so we could investigate it after the sidescan survey was completed. Once the video camera was deployed at a suitable depth to observe the habitat we held it at that depth for 5 to 10 minutes to record the habitat in that area.
We also identified potential grab sites from the sidescan computer monitor, which were noted and surveyed later with a video camera to look at the area before conducting the grab. Two Van Veen Grabs were then taken of the substrate in order to examine surface substrate species.
Click to enlarge
The main substrate, being large rock, is responsible for the large number of Laminaria sp. that were observed. Laminaria sp. will fasten their holdfasts to the substrate in order to hold themselves in place. In order to prevent them from being washed away by water movements, they need to be attached to a stable substrate, one that won’t get washed away with them. This is why the rocky sea floor is ideal for them, rather than the sandy patches where no Laminaria sp. were seen, as here they would just wash away with the sediment.
With plenty of rock available, a dense population of the Laminaria sp. were seen to grow, and these created further habitat for other organisms that were observed. Hydrozoans and Bryozoans were observed growing on the Laminaria directly but the other species observed, such as fish and other free-moving organisms, make their habitat in the surrounding area. This is because the dense Laminaria population offers them protection and shelter, shielding them from the view of predators. For example, macrofauna gain protection from fish while on the kelps [6]. However it is for this same reason that made spotting the organisms living in amongst the Laminaria difficult, so there could have been many other species that we missed simply because the camera was unable to go in amongst the kelp.
There was a very limited view of the habitat from the video as it was only ever taking in one angle at a time, giving a single line to view. It’s a very small piece of the overall area, and there are likely to be many more organisms, and possibly different habitat structures, out of frame. Particularly when compared to the sidescan results and the map plotted with it, there were some distinct boundary lines, showing different zones, in the surveyed area, and yet the video did not pick up these larger differences that were suggested.
It would have been possible to use the Van Veen grab to look at the infauna living in the sandy sediments, and this was the intention, however it was difficult to get the grab in the right place and so it ended up landing on the rock and just pulling up kelp. If the grab had managed to capture a kelp holdfast from the rocky area, more species, such as nematodes [3], could have been identified.
These techniques can play an important part in the conservation and preservation of habitats in the marine environment, allowing for assessments of the marine environment [1], and to identify the distribution and structure [2]. By assessing the habitats and looking at the species that are present, it is possible to draw conclusions about how vulnerable the habitat is, and whether it needs to be protected. Also, by comparing protected areas to other, nearby areas it is possible to see the effects on unprotected areas.
Figure 35: HM Government (2000) Fal & Helford SAC boundary fig. 1a: Fal estuary. Available at: http://publications.naturalengland.org.uk/file/3953490 (Accessed: 27 June 2016).


Figure 36: Google map image to show the area of study.
- Cogan, C. B., Todd, B. J., Lawton, P., and Thomas., T. (2009). The role of marine habitat mapping in ecosystem-based managementICES J. Mar. Sci. 66 (9): 2033-2042 first published online August 6, 2009doi:10.1093/icesjms/fsp214
- Jordan, A., Lawler, M., Halley, V. and Barrett, N. (2005), Seabed habitat mapping in the Kent Group of islands and its role in Marine protected area planning. Aquatic Conserv: Mar. Freshw. Ecosyst., 15: 51–70. doi: 10.1002/aqc.657
- Moore, P.G. (1971). The Nematode Fauna Associated With Holdfasts of Kelp (Laminaria Hyperborea) in North-East Britain. Journal of the Marine Biological Association of the United Kingdom, 51, pp 589-604. doi:10.1017/S0025315400014983.
- Natural England (2015) Fal and Helford SAC: Site information (draft). Available at: https://www.gov.uk/government/publications/marine-conservation-advice-for-special-area-of-conservation-fal-and-helford-uk0013112/fal-and-helford-sac-site-information-draft (Accessed: 25 June 2016).
- Natural England (2000) Fal & Helford special area of conservation management scheme. Available at: http://publications.naturalengland.org.uk/file/3118614 (Accessed: 25 June 2016).
- Nelson, W.G., (1979). Experimental studies of selective predation on amphipods: consequences for amphipod distribution and abundance. Journal of Experimental Marine Biology and Ecology, 3, pp 225-245.
| Physics |
| Chemistry |
| Biology |
| Niskin |
| Flow meter |
| Light meter |
| Exosonde |
| Discussion |
| Physics |
| Chemistry |
| Biology |