

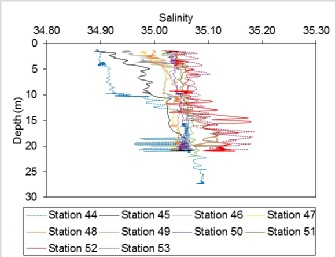
There is a slight increase in salinity with depth at all stations but the maximum increase is only 0.2psu. The salinity spikes that appear on the graph are caused by the unequal response times of temperature and conductivity sensors so the spikes do not reflect actual salinity of the water column. The salinity increased throughout the time series because the tide was coming in until 1209 UTC (the time midway between when the data at stations 50 and 51 were collected. As the site we sampled was very close to the mouth of the estuary, the fresh river water did not have time to progress downriver by the time station 53 was sampled 1 hour after high tide.
Figure 27: Depth profile of salinities from a time series at one station in Carrick Roads in the Fal estuary between 08:00 (Station 44) and 13:40 (Station 53) UTC.
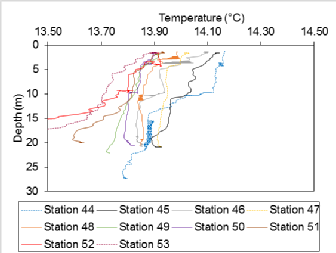
Station 44 was the first station sampled and station 53 was the last. The temperature of the estuary decreased slightly over the course of the time series. This is because the tide was coming in for the majority of the time series so there was an increasing proportion of seawater in the river, which is colder than freshwater. In general, there is a decrease in temperature with depth but the magnitude of temperature change is very small, with temperature only decreasing by a maximum of 0.4°C with depth at stations 52 and 53. At other stations, such as stations 46 and 47, the temperature decreases by less than 0.1°C over the water column.
Figure 26: Depth profile of temperatures from a time series at one station in Carrick Roads in the Fal estuary between 08:00 (Station 44) and 13:40 (Station 53) UTC.
| Physics |
| Chemistry |
| Biology |
| Niskin |
| Flow meter |
| Light meter |
| Exosonde |
| Discussion |
| Physics |
| Chemistry |
| Biology |