

Method:
100ml surface water samples were collected from a Niskin bottle and stored in a glass bottle containing 1ml of Lugol’s iodine solution to preserve and stain the phytoplankton. In the lab, the 100ml solution was reduced to 10ml and stored in a glass vial. Pipetting was used to place the solution on a Sedgewick rafter cell, allowing us to obtain data from 100µl of the solution. The data obtained was a count of different genuses and a total of phytoplankton cells, which was timed by 10 to get a representation of how many cells were in 1ml of the solution.
We used a net with a 200µm mesh and a 50cm diameter connected to a depth meter and a 1L bottle to collect the zooplankton. The net was vertically deployed from Callista, for each sample latitude and longitude for the start and end was recorded. Once the net had been recovered, the seawater containing zooplankton was transferred to another bottle and then fixed with 10% formaldehyde solution.
The sample was inverted to mix, and 10ml was measured from the 1L zooplankton sample, using a measuring cylinder. 5ml of this was pipetted into a Bogorov tray, and the zooplankton were counted and identified under stereo microscope. This was repeated with the remaining 5ml. Calculations were then used to obtain zooplankton per 1m3 of seawater.
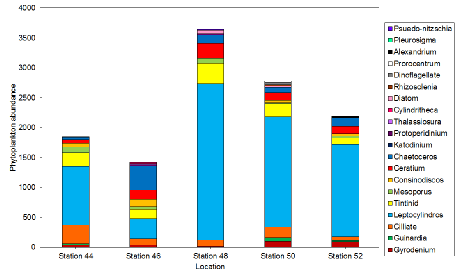
Figure 31: Stacked bar graph of the abundances of different phytoplankton groups at five different times at one station in Carrick Roads in the Fal Estuary on 29/6/16 at one hour intervals between 08:30 and 13:40 UTC. High Water was at 12:09 UTC.
The last three time stations have higher overall abundances than the first two time stations, with ‘Station’ 48 having the highest overall abundance, followed by 50, 52, 44 and 46 with the lowest abundance overall. All time stations have similar diversity, with the highest at time station 50 having the highest diversity, followed by 46 and then 44, 48 and 52 having the same diversity but with different abundances of each species. There are high proportions of Leptocylindrus at all times, although ‘Station 46’ has a higher proportion of Chaetoceros than Leptocylindrus. All time stations have very similar species of phytoplankton, although in very different numbers, which is likely due to daily vertical or horizontal migration by various species in response to light, salinity, tidal cycle or other factors. There are some stations that are the only one or ones to contain certain phytoplankton species, which may be due to the same factors that affect the numbers of other species that are always present.
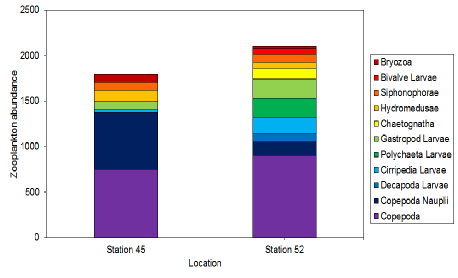
Figure 32: Stacked bar graph of the abundances of different zooplankton groups at two different times at one station in Carrick Roads in the Fal Estuary on 29/6/16 at 10:00 (Station 45) and 12:57 (Station 52) UTC. High Water was at 12:09 UTC.
Time station 52 has a higher abundance than time station 45. 12:57 has a higher number of fully grown copepods than 10:00. It also has more larvae in general than 10:00, except copepod nauplii, where it has less than a quarter of 10:00’s number. Both time stations have many similar species of phytoplankton, although in different numbers, which is likely due to daily vertical or horizontal migration by various species in response to light, salinity, tidal cycle or other factors, which may have increased time station 52’s abundance, being at 12:57 – 48 minutes after high water.
At some stations, such as station 52, the fluorescence is low at the surface, increases up until 5m depth and then decreases steadily until 20m depth. At other stations, such as station 44, there is a slight decrease of fluorescence with depth of 0.03 volts. As with other properties measured during this time series, the variations are very small and an instrumentation lag causes spikes on the plots.
Figure 33: Depth profiles of fluorescence from Station 44 to Station 53.
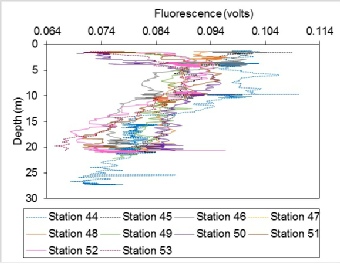
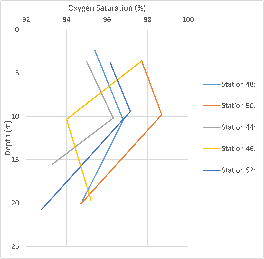
Figure 34: Depth profiles of dissolved oxygen from Station 44 to Station 53.
The oxygen saturation graph shows, for most of the stations that we took measurements for, there was a trend towards higher oxygen saturations at the shallowest depths, around 5m and above, decreasing towards 10m depth and then increasing again at the deepest samples. Station 46 goes against this trend, however. Though it could be that our results for oxygen saturation might not be completely reliable, there is a possibility that human errors could have taken place, in not filling the oxygen bottles up completely or making inaccurate readings when carrying out the titration.
| Physics |
| Chemistry |
| Biology |
| Niskin |
| Flow meter |
| Light meter |
| Exosonde |
| Discussion |
| Physics |
| Chemistry |
| Biology |