


Figure 23a. Contour plot of temperature (°C) measured at depth (m) and time (minutes from 0840 UTC) intervals at the King Harry Ferry Pontoon in the Fal Estuary, measured using an Exosonde probe.
Figure 23b. Contour plot of salinities measured at depth (m) and time (minutes from 0840 UTC) intervals at the King Harry Ferry Pontoon in the Fal Estuary, measured using an Exosonde probe.
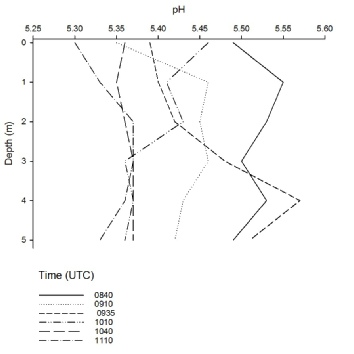
Figure 24a. Depth profile showing how pH varies with depth (m), between six different time intervals (UTC), measured using an Exosonde probe at King Harry Ferry Pontoon in the Fal estuary.
Figure 23b shows that the salinity of the water column decreases throughout the time series. Lower salinity water overlies the more saline water at all points of the time series. There is a much larger salinity decrease at 5m depth than at the surface. Salinity decreases by 0.2 psu at the surface over the time series but by 1 psu at 5m depth.
Figure 23a shows that, generally, temperature increases at all depths within the water column throughout the day. The exception is the water between 3 and 5m depths, where the temperature increases from 15°C to 15.6°C at 1010 but then decreases by 0.2°C throughout the rest of the time series. There is a similar range of temperature change at all depths but the surface reaches the greatest temperatures.
Figure 24a indicates that there is no clear pattern for pH but generally the pH of the estuary decreases by 0.2 over the time series, meaning pH is highest at 0840 but lowest at 1110. pH varies between 5.3 and 5.6. This is too low to be plausible in any estuary, which means that the Exosonde must not have been correctly calibrated, so measurements are arbitrary as there were no other pH measurements to calibrate the probe against.


Figure 24b shows that, on average, dissolved oxygen (DO) decreases with depth, with the greatest DO of 117.2% found at the surface at 1040 UTC, and the lowest DO of 108.1% found at 5m at 0840 UTC. The DO at 1010 UTC remains fairly constant throughout the water column, varying from a maximum of 116.2% at 1m to 115.2% at 2m and 5m.
Figure 24b. Depth profile showing how Dissolved Oxygen varies with depth (m), between six different time intervals (UTC), measured using an Exosonde probe at King Harry Ferry Pontoon in the Fal estuary.
| Physics |
| Chemistry |
| Biology |
| Niskin |
| Flow meter |
| Light meter |
| Exosonde |
| Discussion |
| Physics |
| Chemistry |
| Biology |