


Data was collected on 27th June 2016 along the length of the Fal estuary at four stations, starting at the top of Carrick Roads at 50° 12.212N 005°02.411W and ending at Black Rock at 50° 08.824N 005° 01.544W. Data for the upper half of the estuary was collected by Group 4, and data were compiled together for analysis.
The estuary was expected to be partially mixed due to a strong tidal input compared to a weak freshwater input. Also, the estuary is protected from prevailing southwesterly winds, which may prevent it from being well mixed [1]. A CTD profile and secchi disk measurement were carried out at each station and a zooplankton trawled was taken at stations D56 and G59. Four ADCP transects across the estuary were also undertaken, one near each station.
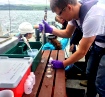
Niskin bottle setting
The top and bottom plugs of the Niskin bottle were pulled out so the Niskin bottle was ready to be fired when needed. The pressure screws were tightened and the taps pulled out so that no water would be released once the bottles were closed.
Metadata
Date: 27/06/2016
Time: 11:52 -14:55 UTC
Location: Fal Estuary
Weather: 7/8 octants cloud cover at 11:52 UTC, 4/8 at 13:23 UTC, varying sunshine, no rain, little wind at survey start, moderate wind towards river mouth.
Water Depth: 19.8 - 33.8m
Tide: High water 09:55 UTC; Low water 16:23 UTC
Air temperature: 15.5 º C
Aim: To compare the physical, chemical and biological properties along the length of the estuary.
Secchi disk method
The Secchi disk was lowered over the side of the boat and observed in the water column until it could no longer be seen. The depth from the side of the boat was noted on the string and the string was measured in length, then the height from the side of the boat to the water’s surface was taken away to find the Secchi disk depth.
Zooplankton method
A zooplankton sample was taken at the first and last stations to get maximum distance difference between the two samples. A net was lowered over the side and the flow meter revolutions were measured at the start and end of a 5 minute period when the net was dragged behind the boat. The boat speed was measured during the sample too. Then the net was brought in and washed to get as much zooplankton into the water sample as possible. The water bottle was then removed from the net and put into a sample bottle to take to the lab for zooplankton analysis.
Rosette deployment and recovery
As the rosette was winched into the air to deploy, it was held to stop it from swaying and guided into the water. The attached cable was payed out as the rosette sank deeper. For recovery, the cable was retrieved along with the rosette, which was stopped at some discreet depths (deep, middle and surface) and two Niskin bottles fired at each depth to collect water samples for various measurements by the team in the wet lab.
Physical
Temperature, salinity and ADCP results.
Chemical
Nitrate, phosphate and silicon depth profiles and mixing diagrams of the Fal Estuary.
Biological
Phytoplankton, zooplankton, chlorophyll and dissolved oxygen results.
ADCP
The flow in the Fal Estuary was measured along transects using the ADCP. To do this, points were selected down the estuary to be sampled. At each point, the transect was started just off the bank. From here the transect was started and a note was taken of the position and the distance from the shore while the ADCP recorded flow measurements. Once it reached the other side, the recording was stopped and the distance and position noted. This was done along four points down the estuary.
CTD
A rosette containing 6 Niskin bottles with a fluorometer, turbidity monitor and CTD attached was the first instrument lowered into the water. Using the CTD to measure temperature and salinity profiles, the fluorometer to measure chlorophyll concentration and the turbidity monitor, the depth was deduced for firing the Niskin bottles through lowering the instrument to the just off the bottom thus providing a profile of each parameter. Note the CTD was not lowered any closer to the bottom than 2 to 3 metres to avoid drifting into shallower water and fouling the machinery. Niskin bottles were then fired on the way up, taking 2 replicates at each depth, usually a deep water, intermediate water and surface water sample for later laboratory analysis.

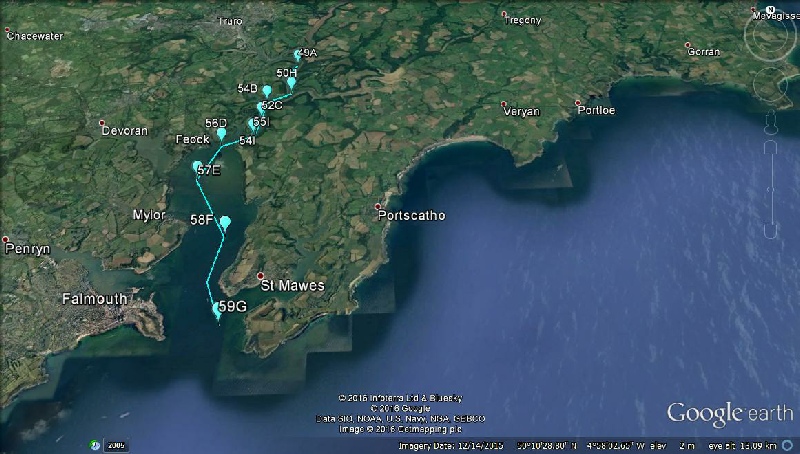
Figure 3. Google Earth satellite image showing the path of Conway and sampling stations during the survey of the Fal Estuary.
- HM Government (2013). About Falmouth. Available at: https://www.falmouthtowncouncil.co.uk/about-falmouth (Accessed 25th June 2016).
| Physics |
| Chemistry |
| Biology |
| Niskin |
| Flow meter |
| Light meter |
| Exosonde |
| Discussion |
| Physics |
| Chemistry |
| Biology |