
The views and opinions expressed in this website are not necessarily those expressed by the National Oceanography Centre or the University of Southampton. The opinions and views expressed are those of the authors of the website

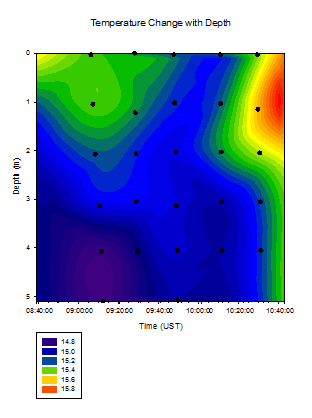
A decrease in temperature with depth is expected, partly because of the lesser effect of the sun deeper in the water, but also due to more saline, cooler, denser water being at lower depths. However, as we are measuring temperature in an estuary, we would expect to see various changes in the data, due to differing fluxes of freshwater and saltwater dependant on river input, tidal height and tidal strength amongst other factors. As the tide recedes, there is a decrease tidal input, the relative river input is higher consequently an increase in temperature over the period of sampling, due to an ebbing tide.
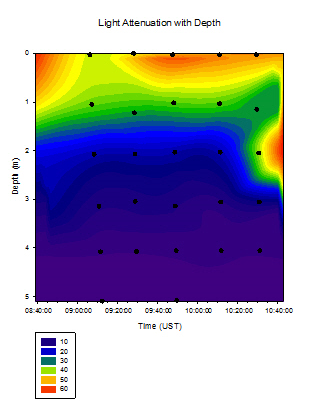
We found that the irradiance decreased with depth, which is to be expected because light attenuates exponentially with depth. However the weather was very variable, and during a rain shower it can be expected that there will be an even quicker loss of light with depth. This is shown in the contour plot at 9:10 UST, where there is a marked decrease in irradiance, and we also noted a rain shower at this time. The last sample, at 10:40 UST showed a much higher irradiance deeper in the water than previous samples. This could be because the weather was much brighter at the end of the sampling, as the clouds cleared away.
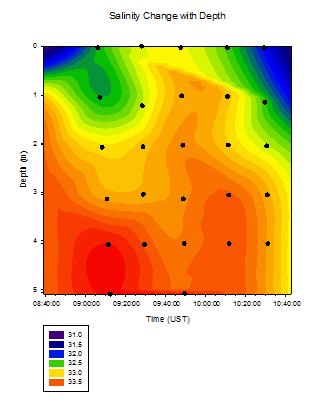
We found that the water composition chnages to become more saline with depth. As saline water is more dense than freshwater, it will sink beneth a layer of freshwater. This is evident in the data we collected and shown in the contour graph. We also found that over the period of time we were sampling, there was an overall shift of the composition to have a higher freshwater proportion. This corrolates with the tides as high tide was at 8:14 UST, and low tide was at 14:14 UST, meaning that the tide was going out whilst we were taking samples. This means theoretically that we should see a shift toward a higher freshwater content over the samples as there is overall a higher freshwater input than salt water input.
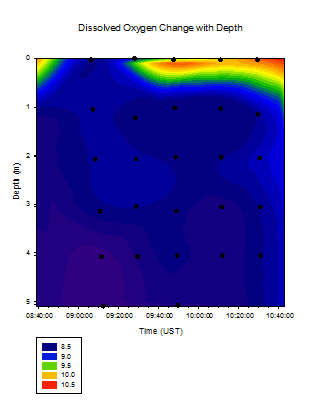
We found that with depth, the level of dissolved oxygen decreases and we also found this to be consistent across the time series. This is to be expected because dissolved oxygen enters the water via the air. It diffuses slowly across the surface but can also be mixed in quickly through aeration. At 9:10 UST we noted heavy rain, which we expected to increase surface dissolved oxygen levels, however it had the opposite effect. We have put this down to an error in the equipment. There does appear to be a slight increase with surface dissolved oxygen level across time, however the change is so slight that we have not deemed it significant.
Temperature
Salinity
Light Attenuation
Dissolved Oxygen
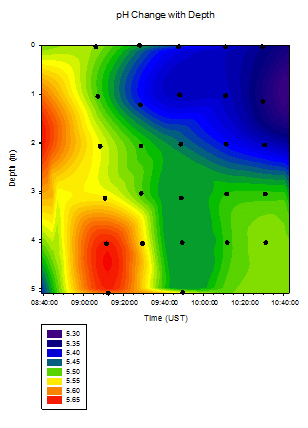
We found the pH in the estuary to be very variable across both time and depth. There does appear to be a slight shift toward lower pH in the surface 2.5m toward the end of the time series. Whilst the change in pH is not major, it could be due to an increased river input. This river input would be slightly more acidic due to the weathering of carbonate rocks. Throughout the time series however, the pH stays between a range of 0.35, which is not a particularly significant change.
pH
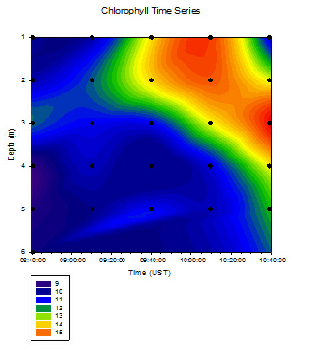
The chlorophyll content showed a strong increase between 9:40:00 UST and 10:20:00 UST. The chlorophyll content is a proxy for the presence of phytoplankton. This would indicate that there was a marked influx during afore mentioned times. This may have been because, after the heavy rain, there would have been a marked increase in oxygen content of the upper layers of the water. Apart from the increase in those times, the chlorophyll content doesn’t appear to follow any particular pattern across both time and depth.
Chlorophyll
This page shows a graphical representation and description of each factor that was investigated whilst collecting data at the pontoon.
Pontoon Results
Figure 5.0 A contour plot showing temperature against depth
Figure 5.1 A contour plot showing salinity against depth
Figure 5.2 A contour plot showing pH against depth
Figure 5.3 A contour plot showing Light Attenuation against depth
Figure 5.4 A contour plot showing Dissolved Oxygen against depth
Figure 5.5 A contour plot showing Chlorophyll against depth