The views and opinions expressed in this website are not necessarily those expressed by the National Oceanography Centre or the University of Southampton. The opinions and views expressed are those of the authors of the website

The aim of the biological section of data collection was to determine the phytoplankton and zooplankton population distribution at Station b over a set time period.
Location of site that data was collected at:
Latitude: 50deg 05.67’ N
Longitude: 4deg 52.02’ W
The time for each site is as follows:
Station 28 -
Station 29 -
Station 30 -
Station 31 -
Station 32 -
Biological Introduction
Zooplankton
A zooplankton net with a 200 mesh was lowered to so as to collect zooplankton from 30m to 10m deep at Station b. The samples were then recovered and 1L of sample was then preserved using 100ml of formaldehyde 10%. Upon return to the laboratory, 10ml of the 1L samples were quantitatively analysed using a light microscope and a Bogorov chamber using an identification guide. Finally the amount of zooplankton per m3 was calculated using the following equation:
N = (nx100) / V
with : N – Number of zooplankton per m3
n – Number of zooplankton per 10ml of
a 1L sample
V – Volume of seawater sampled (m3)
Phytoplankton
Niskin bottles attached to a CTD rosette were used to sample the water column at discrete depths. The depths were chosen based on the descending CTD profile and the water column structure that it indicated. 100ml of each sample was collected and stored in dark glass bottles containing lugol. This enriched the sample so as to make the phytoplankton easier to detect and identify under a light microscope. They were then quantified and identified using identification guides.
Methodology
Site Information
Key Findings
Figure 3.0. The abundances of the different phytoplankton species sampled at different depths at station B offshore of the Falmouth coast. n = 1.
Figure 3.2 The abundances of the different phytoplankton species sampled at different depths at station B offshore of the Falmouth coast n = 1.
Figure 3.1. The abundances of the different phytoplankton species sampled at different depths at station B offshore of the Falmouth coast. n = 1.
The results from figure 3.0 and 3.1 show that Cerataulina had the highest mean abundance across all depths with a value of 680 indiv./ml for figure 3.0 and a value of 903.3 indiv./ml ± SD 1004 indiv./ml for figure 3.1. Figure 3.2 shows that Skeletonema had the highest mean abundance with a value of 630 indiv./ml ± 229.1 indiv./ml. Skeletonema also had the second highest mean abundance in figure 3.1 with a value of 835 indiv./ml ± 912.2 indiv./Ml.
Furthermore, in terms of species richness, the highest species richness in figure 3.0 was found at a depth of 5.5 with seven different species being present. The highest species richness in figure 3.1 was found at a depth of 20.7m with a richness of six different species; furthermore, the highest species richness in figure 3.2 was found at a depth of 23.5m with a richness of six different species.
Moreover, for figure 3.0, the lowest species richness was found at a depth of 25.1m and 30.8m, where only three different species were present. For figure 3.1, the lowest species richness was found at a depth of 24.7m, 30.5m and 41m, where only two different species found and for figure 3.2, the lowest species richness was found at a the maximum depth of 40.4m, where only one species of Ciliate were found.
The reason Cerataulina was found in the highest abundances across two stations was because the diatom Cerataulina species are summer species and so their population blooms coincided with our sampling times, resulting in them becoming dominant against the other species (Reynolds, 2006). Skeletonema is another example of summer species but because it is smaller than Cerataulina, it has a higher growth rate at lower temperatures that are not typical of summer and summer stratification of the water column favours the larger phytoplankton (Reynolds, 2006).
The reason why there is typically a higher species richness in the shallower depths is because of Sverdup’s critical depth hypothesis, which dictates that during the summer stratification of the water column, improved light, temperature and stratification conditions enhance phytoplankton growth and reduce interspecific competition (Behrenfeld, 2010).


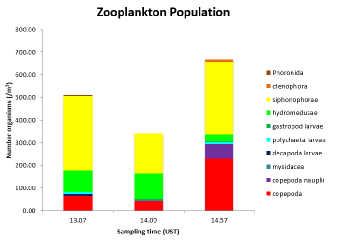
The highest number of organisms per m3 was observed at station 3 at 14.57, seen in fig X, at over 650 individuals per m3. This station also had the highest diversity of organisms, with 7 zooplankton types identified in the laboratory. Diversity within these classes is difficult to estimate as the zooplankton were not all identified to species level.
Across all three stations siphonophores were the dominant zooplankton with a minimum of 176 individuals per m3 at Station 2, and a maximum of 327 individuals per m3 at Station 1. Station B remains within the coastal influence and it is therefore expected to have a relatively high productivity. The dominance of siphonophores was therefore unexpected, as siphonophores and hydromedusae operate in low productivity regions characterised by small flagellated phytoplankton and copepods (Mills, 1995).
As opportunistic predators, they are ideally built for taking advantage of the phytoplankton spring bloom and the presence of copepods and copepod nauplii and other flagellated phytoplankton might partly explain their dominance. Hydromedusae were present in small numbers, with a maximum of 112. Individuals per m3 at 14.00, but in compared to the number of siphonophores they were far from being dominant.
Phytoplankton
Zooplankton
Fig. 3.3 Zooplankton population composition depending on sampling time at Station b. Note the constant abundance of Chaetoceros, contrasted with the varied presence of Ceratulina.

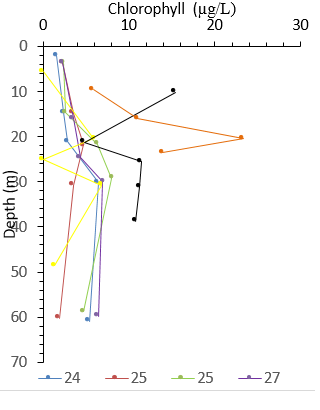
Starting in the surface waters, the chlorophyll at most of the stations increases
with depth until reaching a maximum between 20 and 30m which also coincides with
the start of thermocline. The increase in chlorophyll is directly to an increase
in the numbers of phytoplankton in the water column, due to increased levels of key
nutrients. This figure also shows that below a depth of 30m all the stations show
a decrease in chlorophyll with depth. At a depth between 20-
Chlorophyll
 Back to Top
3.4 Depth profile showing the changing chlorophyll levels at four time intervals at the same site.