The views and opinions expressed in this website are not necessarily those expressed by the National Oceanography Centre or the University of Southampton. The opinions and views expressed are those of the authors of the website

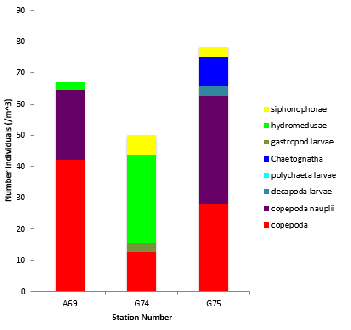
At stations 69A, the most abundant zooplankton population was that of the copepods
which had a population of 42.19 indiv./m-
The purpose of this survey was to assess the biology of the Fal estuary from the Truro River to Black Rock. This included phytoplankton as well as their predators, zooplankton. By evaluating the plankton in the laboratory more closely, we could evaluate their distribution along the estuary, as well as the population composition at the time and location of sampling. The chlorophyll levels at changing depth were also investigated
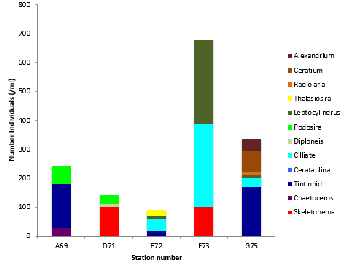
At station 69A, the most abundant phytoplankton population was that of the tintinnid
which had a population of 150 indiv./m-
Biology of the Estuary


Zooplankton
Phytoplankton
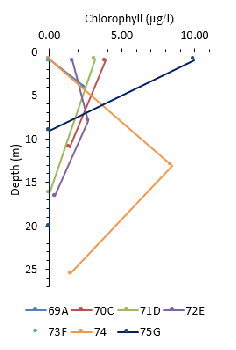
The majority of the stations show that chlorophyll decreases with depth below approximately 10m. The stations also show an increase in chlorophyll from the surface to a maximum at a certain depth; between 5 and 15m. This trend arises because at the surface nutrients are depleted due to biological uptake and increases with depth. The depth of maximum chlorophyll is the point at which there is enough light for photosynthesis and a necessary amount of nutrients for growth. However, stations 71D, 70C, and 75D show a decrease from a maximum at the surface to a minimum at depth.
Chlorophyll

Figure 4.0 A stacked column chart showing the zooplankton abundances and distribution across three stations from the Fal Estuary
Figure 4.1 A stacked column chart showing the phytoplankton abundances and distribution across five stations from the Fal Estuary
Figure 4.2 Depth Profile of Esturarine Cholorphyll at seven stations