The views and opinions expressed in this website are not necessarily those expressed by the National Oceanography Centre or the University of Southampton. The opinions and views expressed are those of the authors of the website

On RV Callista, collection was done through the use of Niskin bottles mounted on a CTD which were fired at different depths. This allowed for samples that would illustrate any trends or patterns throughout the water column. Samples were then filtered in the wet lab onboard and processed for later analysis in the lab. In the lab, samples were once again processed to analyze their concentrations. Nitrate values were then analyzed using a spectrometer.


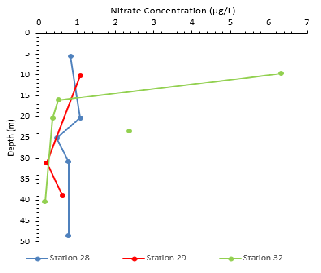
Upon analysis of nitrogen concentrations from stations 28, 29, and 32, trends for each of the three stations could be compared. Nitrate concentrations at stations 28 and 29 remained fairly constant with increasing depth while station 32 exhibited different behaviour. The outlier at station 32 could deviate harshly due to temporary temperature or salinity fronts that existed within the water column.
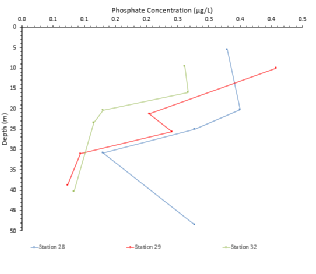
Upon analysis of phosphate concentrations from stations 28, 28, and 32 trends or relationships in the data could be analysed and compared. Stations 29 and 32 both exhibit a decrease in phosphate concentration while station 28 appears to decrease until a depth of 30 meters where it then begins to increase again. Like the nitrate concentration data, this could be due to salinity or temperature fronts at differing depths.
Figure 3.5. Nitrate concentrations in µg/L against depth in meters for stations 28, 29, and 32. There is one outlier present for station 32 with a nitrate concentration of 2.36 µg/L and a depth of 23.5 m.
Figure 3.6. Phosphate concentration in µg/L against depth in meters for stations 28, 29, and 32.
Chemistry
Nitrate
Phosphate
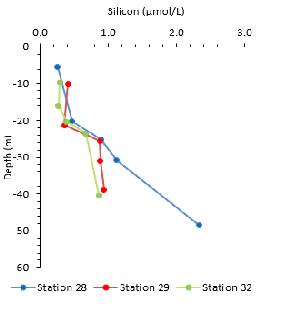
At all three stations, the concentration of silicon increased below the depth of 20. An increase in silicon concentration was observed at all depths at station 28 where Niskin bottles were fired and samples were taken. Both stations 29 and 32 displayed a slight initial decrease in concentration before an increasing below 20m. Station 29 exhibited the largest decrease in silicon at depths above 20m: the concentration of silicon decrease by 0.02µmol/L between 10.4m to 20.1m.
The observed increase in silicon below 20 metres might indicate the bottom of the surface layer, that is to say the seasonal thermocline. Due to restricted mixing between the two layers, remineralisation below the thermocline exceeds the uptake of silicon by phytoplankton. This results in an increase in silicon below the thermocline.
Silicon
Figure 3.7. Silicon concentration in µmol/L against depth in meters for stations 28, 29, and 32.

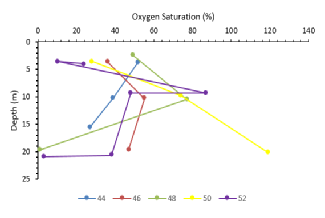
Figure 3.8 shows that oxygen spikes at an approximate depth of 9-
Oxygen Saturation
Figure 3.8. Depth profile of Oxygen Saturation at five time points.
 Back to Top