The views and opinions expressed in this website are not necessarily those expressed by the National Oceanography Centre or the University of Southampton. The opinions and views expressed are those of the authors of the website

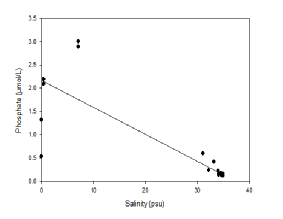
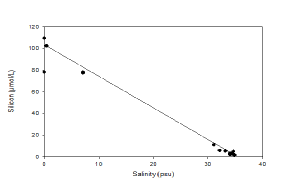
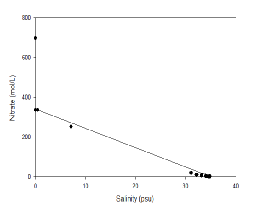
Figure 4.6 indicates that nitrate behaves non-
Figure 4.7 indicates how phosphate concentrations vary across the Fal estuary. It does not plot along the theoretical dilution line; therefore it did not behave conservatively during our period of study. There was variation in the concentrations of phosphate along the whole theoretical dilution line, especially around the river end members. Both removal and addition processes are implied by the position of the samples along the theoretical dilution line: addition could be due to pulse events such as soil disturbance or continuous events such as sewage or other waste disposal; removal could be due to settling to the sediments or use by organisms such as phytoplankton (Smith and Longmore, 1980).
Silicon, behaves relatively non-
Estuarine mixing diagrams can be used to determine whether a chemical constituent
is acting conservatively or non-
REFERENCES
Domingues, R., Barbosa, A., Sommer, U. and Galvão, H. (2011). Ammonium, nitrate and
phytoplankton interactions in a freshwater tidal estuarine zone: potential effects
of cultural eutrophication. Aquatic Sciences, 73(3), pp.331-
Paasche, E. (1973). Silicon and the ecology of marine plankton diatoms. II. Silicate-
Smith, J. and Longmore, A. (1980). Behaviour of phosphate in estuarine water. Nature,
287(5782), pp.532-
Figure 4.6 Estuarine Mixing Diagram showing Nitrate in the Fal Estuary with a Theoretical Dilution Line, hover over image to see zoomed samples
Figure 4.7 Estuarine Mixing Diagram showing Phosphate in the Fal Estuary with a Theoretical Dilution Line, hover over image to see zoomed samples
Figure 4.8 Estuarine Mixing Diagram showing Silicon in the Fal Estuary with a Theoretical Dilution Line, hover over image to see zoomed samples
Chemisty
Nitrate
Phosphate
Silicon
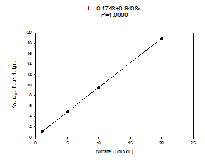
Standards
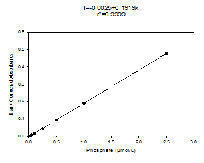
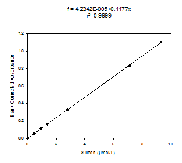
Figure 4.3 This is the Nitrate Standard for the known sample concentrations, calculated in the lab.
Figure 4.5 This is the Silicon Standard for the known sample concentrations, calculated in the lab.
Figure 4.4 This is the Phosphate Standard for the known sample concentrations, calculated in the lab.
