
The views and opinions expressed in this website are not necessarily those expressed by the National Oceanography Centre or the University of Southampton. The opinions and views expressed are those of the authors of the website

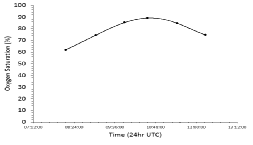
Figure 4.9 shows a gentle increase and then decrease curve in the time series results. The oxygen saturation increases with time, until a time at 10:34 UTC where it reaches its maximum value of 89.1%. Following this, the oxygen saturation decreases with depth as the day progresses. Interestingly, the saturation at the end of the series is higher than the saturation at the start, with a start value of 62% and an end value of 74.7%.
A CTD and ADCP were used to collect data on the water column in the Fal estuary. The CTD was deployed at seven different stations along the estuary to a maximum depth of approximately 25m at the stations near the river mouth. The CTD recorded data on temperature, salinity, depth, transmittance and fluorescence at each of the stations. The ADCP was used to collect data of water flow velocity throughout the water column. At each station transects were taken from one side of the estuary to the other, with measurements constantly being recorded. ADCP transects were also taken between each station to build up an image of the water flow velocity of the whole region of the estuary sampled.
Figure 4.10 shows the ADCP estuary transect from site A69, which is the first sample
site as well as being the furthest upstream. The transect was recorded between 08:24UST
and 08:26UST and was recorded horizontally across the estuary taken from the eastern
bank to the western. The location of the start of the transect was 50°14.3706N 5°00.9360W
and the end location was 50°14.384N 5°00.842W. The transect shows a predominant dark
blue colour representing a velocity of 0.0394m/s. There are infrequent regions of
green and pink showing velocities of 0.779m/s and 0.009m/s. The overall image suggests
a well-

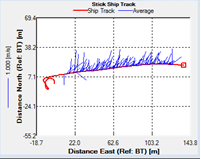
Figure 4.11 shows the average flow velocity with depth for transect A69. The transect was taken in an eastward direction represented by the red track line. The average flow velocity with depth shown in blue clearly shows the movement of water to be in a northward direction. This was to be expected as water is moving up the estuary due to the approaching high water.

Figure 4.12 shows the ADCP recording from station D71. This transect was at the approximate
mid-
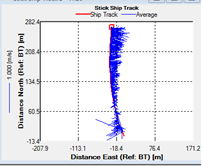
Figure 4.13 shows the ship track for site D71. The image shows the flow velocity is in a strong average eastward flow as shown by the blue line. There are some average flow lines which are in a westward flow near the southern section of the image.

Figure 4.14 shows the ADCP transect from site G75 (Black Rock), which is the site closest to the river mouth. The transect was recorded between 12:33UST and 12:48UST and the location of the start of the transect was 50°08.8941N 5°01.1582W and the end location was 50°08.775N 5°02.562W. The image shows a predominant purple colour meaning a velocity around 0.002m/s. The transect was recorded just after high tide 12:09UST so low velocity would be expected this is due to slack water.
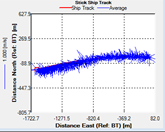
Figure 4.15 shows the ship track and average flow velocity with depth for
site G75. The ship transect was taken from west to east shown by the red line. The
water movement is fairly even with a more southern flow on the left of the image.
The right hand side shows an steady north-
When looking at the CTD data the river estuary was determined to be well mixed, this is supported by the ADCP transects from both site A69 and G75 by one colour being dominant showing one speed being dominant.
Figure 4.9 Line graph of Oxygen Saturation against Time from the Fal Estuary
Figure 4.10 A transect of Site A69 showing the Depth and flow velocity of the Fal Estuary.
Figure 4.11 Ship Track of the transect taken at site A69 showing water column velocity
Figure 4.12 A transect of Site D71 showing the Depth and flow velocity of the Fal Estuary.
Figure 4.13 Ship Track of the transect taken at site D71 showing water column velocity
Figure 4.14 A transect of Site G75 showing the Depth and flow velocity of the Fal Estuary.
Figure 4.15 Ship Track of the transect taken at site G75 showing water column velocity
Pontoon Physical
Oxygen Saturation
Estuarine ADCP Data
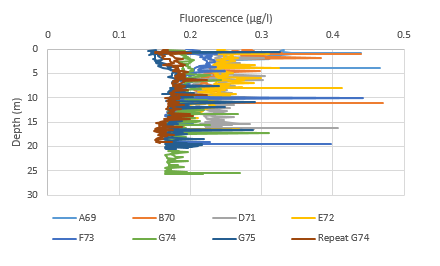
Generally the fluorescence depth profiles show an increase to some depth then a decrease below this. Fluorescence is directly linked to chlorophyll in the water. There is an overall low fluorescence at the surface because nutrients are depleted at the surface so there are reduced levels of chlorophyll. It increases to a maximum at the beginning of the thermocline then decreases with depth below this point. This is due to light levels being too low for photosynthesis occur so lower chlorophyll concentrations exist here. Looking at the profiles in greater detail, they all follow the trend of a peak in fluorescence at the surface, above and below the thermocline, and just above the estuary bed. This arises because these points provide ideal light and nutrient conditions for successful chlorophyll production, the depth of these maxima increase down the estuary as the total water depth increases.
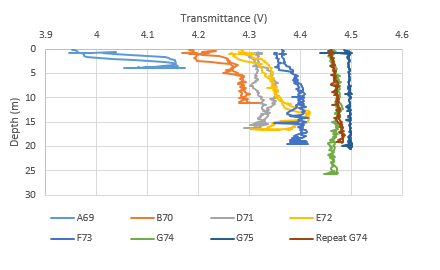
Overall, the transmittance increases with depth and from the river end to the seaward end of the estuary. This is due to more suspended material being transported at the top of the estuary compared to the mouth because the water has more energy to carry a larger amount of material at the riverine end than the seaward end as the banks widen towards the estuary mouth. It increases towards the estuary bed because there is more friction between the water and the bottom than that of the air and the surface water. This results in greater turbidity in the bottom water than at the surface.
Figure 4.19 Depth Profile of Fluorescence at seven stations and one repeated station
Figure 4.18 Depth Profile of Transmittance at seven stations and one repeated station
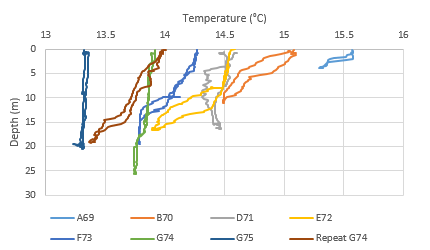
Figure 4.17 Depth Profile of Temperature at seven stations and one repeated station
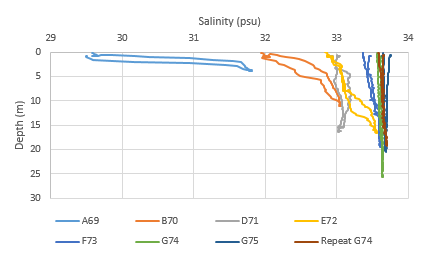
Figure 4.16 Depth Profile of Salinty at seven stations and one repeated station
The temperature profiles recorded during the sampling period showed a stepwise decrease
in the temperature of the surface waters from the riverine-
The temperature profile of each station starting at the initial riverine station,
A69, down towards Blackrock showed a gradual progression from a well-
At all of the stations throughout the sampling period salinity increased with depth,
as expected. In the surface waters, salinity also increased as the location of the
sampling stations progressed from the freshest water at the riverine-
A halocline was present in all station from A69-
CTD Data
 Back to Top
Back to Top
Back to Top
Back to Top
Back to Top
Back to Top
Back to Top
Back to Top
Back to Top
Back to Top
Back to Top
Back to Top
Back to Top