Disclaimer: the views and opinions expressed are those of Group 9 members and not necessarily those of the University of Southampton, National Oceanography Centre or Falmouth Marine School


NITRATE (Fig 2) -
CHLOROPHYLL (Fig 5)-
The Chlorophyll maximum values are found near the pycnocline and thermocline, suggesting an increase on the phytoplankton concentration in these regions in despite of the surface and sea bottom. According to Sharples et al. (2001), the growth of phytoplankton requires sufficient supplies of light and nutrients and since the development of continuous fluorescence measurements, the thermocline has been observed to be a region of enhanced chlorophyll concentration, as well as the region of the maximum density gradient (pycnocline). The low concentrations of chlorophyll at surface indicate the removal of nutrients from the surface waters during the spring bloom, limiting phytoplankton growth in the surface during summer. The decrease in chlorophyll concentration below the thermocline can be due to light limit conditions. Near the thermocline, some mixing is occurring and enhancing the nutrient supply to the euphotic zone, originating areas of high primary productivity (Pennington et al., 2006).

Figure 2 -
O2 (Fig 3) -
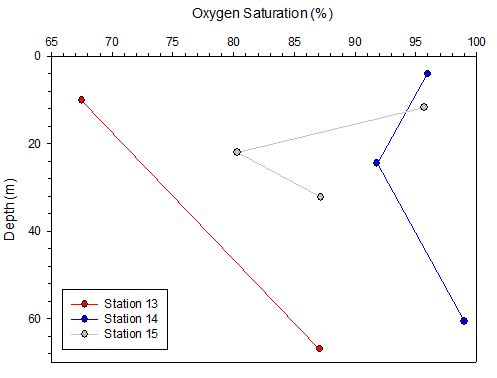
Figure 3 -
SILICON (Fig 4) -
According to Sarmiento et al. (2004) the ocean’s biological pump strips nutrients out of the surface waters and exports them into the thermocline and deep waters. This statement means that we would expect to see a vertical profile with low silicon concentration values at the upper water column, with a subsequent increase in concentration with depth. However, at the sampled stations of this survey the silicon concentration had the highest value on the surface, presenting a decrease in concentration with the increasing depth. The peak in silicon concentration at depths ranging from 20 to 40m suggests an increase in the biological uptake associated with a well defined and highly stratified seasonal thermocline. The peak area with low values of silicon coincides with the Chlorophyll maximum values, indicating the presence of diatoms which incorporate dissolved silicon in their frustules (Bell, 1994). The observed decrease of concentration below the thermocline can show that there is still some stratification preventing mixing between waters situated above and below the thermocline.

Figure 4 -
Bell, R.G. (1994). Behaviour of Dissolved Silica, and Estuarine/coastal Mixing and Exchange Processes at Tairua Harbour, New Zealand. New Zealand Journal of Marine and Freshwater Research. 28 (1). p.55–68.
Borges A. V., M. Frankignoulle.. (2003). Distribution of surface carbon dioxide and
air-
Pennington, J.T., Mahoney, K.L, Kuwahara, V.S., Kolver, D.D., Calienes, R.& Chavez,
F.P. (2006) Primary production in the eastern tropical Pacific: A review. Progress
in Oceanography. 69. p.285-
Sarmiento, J.L., Gruber, N., Brzezinski, M.A. & Dunne J.P. (2004). High-
Sharples, J., Mark Moore, C., Rippeth, T.P., Holligan, P.M., Hydes, D.J., Fisher,
N. R. & Simpson, J.H. (2001) Phytoplankton distribution and survival in the thermocline. Limnology
and Oceanography. 46 (3). p.486-
Smyth T, J., J. R. Fishwick, L. AL-

Figure 5 -


Figure 6 -
PHOSPHATE (Fig 6) -
at around 24.5m. Station 13 shows the expected trend of reducing in surface waters due to primary producers abundance before the increase with depth. Phosphate is used by organisms within the upper water column for growth and would be remineralised at lower depths through biological breakdown. The remineralisation account for the increase shown in Stations 13 and 15. Station 15 has a higher initial concentration of PO4 due to increased riverine input. The station then follows the expected increase with depth. Station 14 shows an unexpected increase in the PO4 concentration between the depths of 4 and 24.5m. This can be due to being located at the front two water increasing the PO4 concentration beyond the expected. The deep chlorophyll maximum at Station 14 results in the decreasing PO4 from 24m.
AIM -

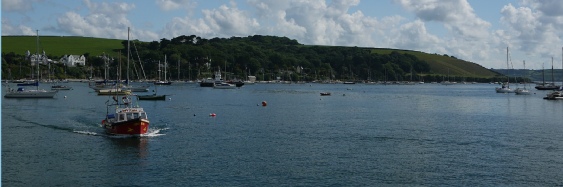
On Wednesday 24th June 2015, Group 9 took part in a scientific research trip on the RV Callista to locations off the coast of Falmouth, UK. The trip sampled three depth profiles and net catches, at Stations 13, 14 and 15. It took approximately 5 hours between 07:00 UTC and 12:00 UTC. The first station was the furthest offshore with the subsequent stations successively inshore. Conditions were ideal for sampling with minimal swell and waves, and clear skies with very light winds. The only noticeable wave motion came from close passing ships. The only issue was failure of the plankton net closing at the correct depth.
Surveying occurred on a neap tide.

Table 1 -
|
Date |
Station |
Time (UTC) |
Location |
Weather |
Tide time |
Tide height/m |
|
24/06/15 |
13 |
08:40
|
Lat - Long - |
Thin cloud 4/8 coverage Mostly sunny |
Low tide 04:19 UTC High tide 10:08 UTC |
4.9 0.7 |
|
|
14 |
10:07 |
Lat - Long - |
Thin cloud 4/8 coverage Mostly sunny |
|
|
|
|
15 |
11:03 |
Lat - Long - |
Thin cloud 5/8 coverage Slightly choppier water due to more wind. |
|
|

To attain the data ,four pieces of equipment were deployed. A CTD rosette with Niskin bottles, an ADCP and a plankton net.
To obtain the chemical data, a CTD rosette with niskin bottles was used. The samples were then preserved with 10% Formalin for analysis in the lab.
CHEMICAL ANALYSIS METHODOLOGY -
Note that in some cases we refer here to manuals for methods rather than the original method paper that may have undergone some modifications.
Manual chlorophyll, dissolved Phosphate and Silicon -
Dissolved oxygen -
Nitrate by Flow injection analysis -