Disclaimer: the views and opinions expressed are those of Group 9 members and not
necessarily those of the University of Southampton, National Oceanography Centre
or Falmouth Marine School


INITIAL FINDINGS;-
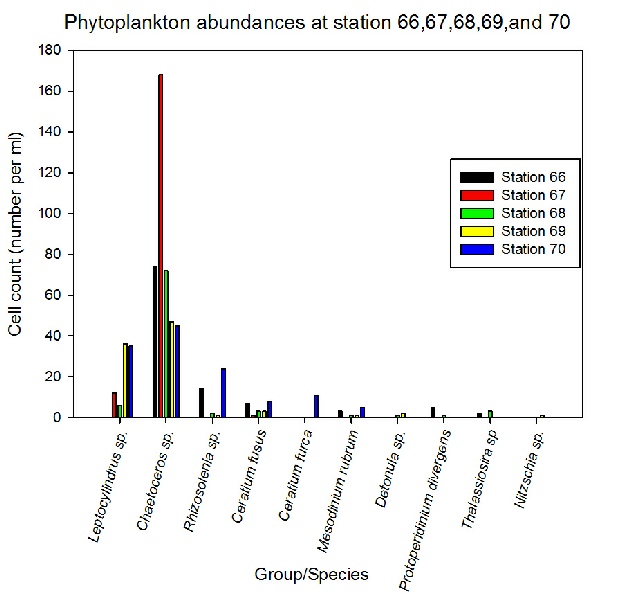
Figure 3;-
Overall the most abundant phytoplankton species is Chaetoceros sp. This species was
located within Stations 66-70 with the highest cell count appearing within Station
67 with a count of 168 cells per ml. At Station 67 the Chaetoceros sp. were found
to dominate with very few other species being found within the sample. High nutrient
concentration as well as the possibility for nutrient addition leads to the diatom
abundances to bloom. The higher abundances at the shallower depths fits with the
previous research (Kemp, 2013).
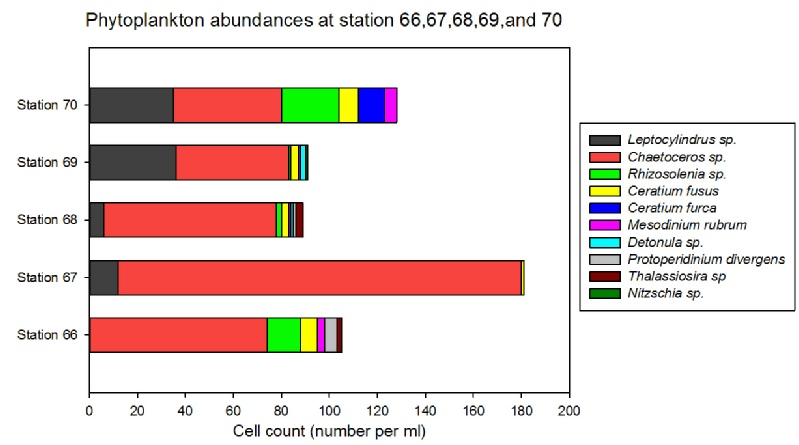
Figure 4;-
The station with the largest cell count was Station 67, which consists of three different
species of phytoplankton compared to the other stations which are shown to have a
wider range of different species. Station 70 is the station which is the furthest
out of the estuary which leads to different composition within the phytoplankton
community. Figure? shows the dominant form of phytoplankton within the estuary is
diatom species with a significant Chaetoceros sp abundances.
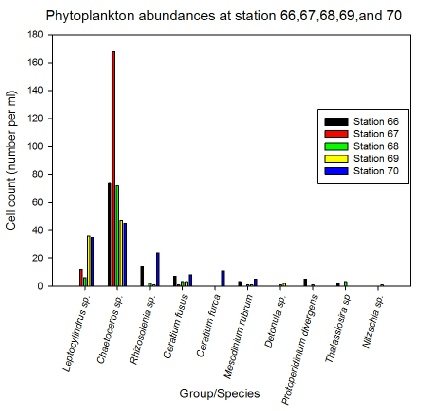

Figure 3 – A graph showing the species located at Stations 66-70. The graph uses
cell count, number per ml, to clarify the abundance of each of the identified species
Figure 4 – A stacked bar chart showing the relative abundances of each species of
phytoplankton located at Stations 66-70.
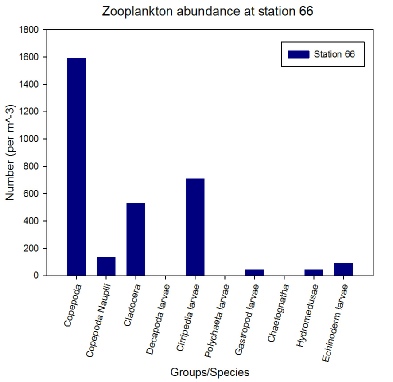
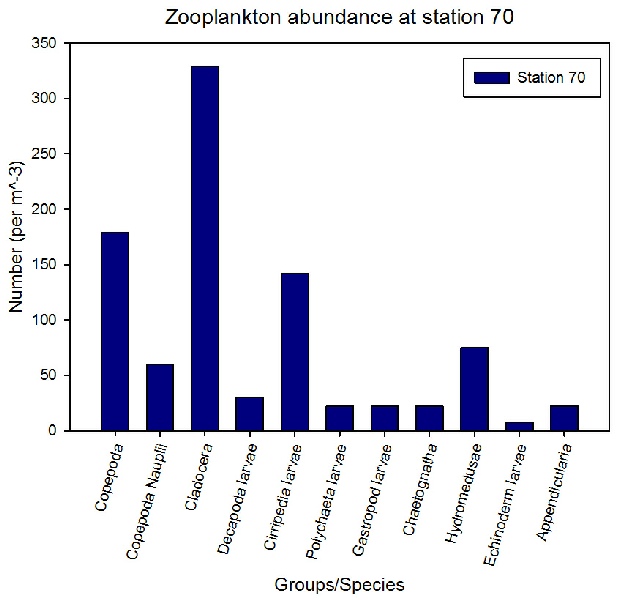
Figure 5 – A graph showing the average abundance of zooplankton per m3 against the
species of zooplankton for Station 66 from one net sample
Figure 6 – A graph showing the average abundance of zooplankton per m3 against the
species of zooplankton for Station 70 from one net sample
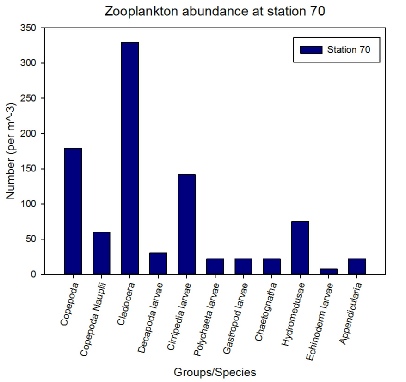

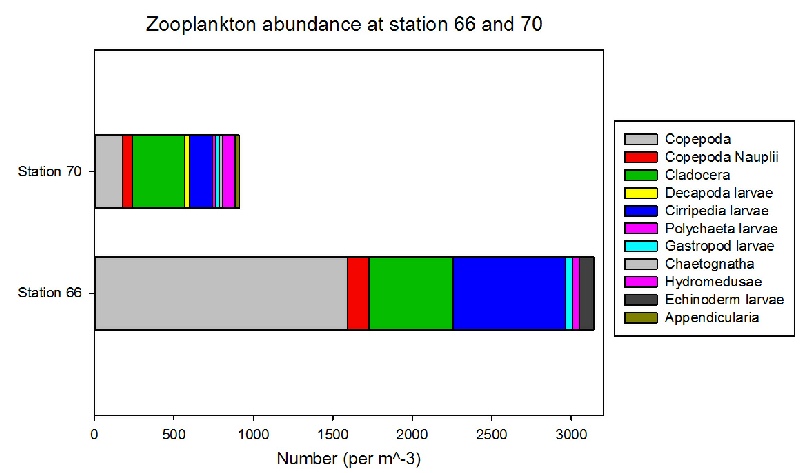
Figure 7 – A stacked horizontal bar chart showing average number of zooplankton per
m3 of each sampling station.

INITIAL FINDINGS;-
Zooplankton data was collected from two of the 5 sampling stations, Station 66 (most
riverine station) and Station 70 (most seaward station). From the zooplankton nets
sampled, it can be seen that station 66 has a low diversity of zooplankton but supports
a high abundance of the few groups present. In comparison Station 70 has a higher
diversity of zooplankton but does not support high abundances of the zooplankton
present.
From the two stations sampled, the most commonly identified zooplankton were the
copepods and the cladocerans. A total of 11 different zooplankton groups/species
were identified with 7 groups/species being present at both stations; copepod (nauplii
and mature forms), cladocera, cirripedia larvae, gastropoda larvae, hydromedusae
larvae and echinoderm larvae.
Station 66 was found to have the higher of the two zooplankton abundances with a
total number of 3139 per m-3 compared to 910 per m-3 found at Station 70. Station
70 had the higher zooplankton diversity of 11 different groups/species whilst Station
66 had 7. Looking at the phytoplankton analysis, this is to be expected based on
the fact that a greater diversity of phytoplankton species were observed at Station
70. The increased phytoplankton diversity would support a greater number of different
species of zooplankton due to a greater range of specific food sources.
Copepods were found to be the most dominant group of zooplankton at Station 66, with
1592 individual per m-3 accounting for 51% of the zooplankton sampled. Cirripedia
larvae were also found to be relatively abundant here with 707 per m-3 being identified
accounting for 23% of the sample. In comparison, cladocerans were found to the most
dominant zooplankton at Station 70 with 329 individuals per m-3 recorded, accounting
for 36% of the sample.
The dominance by a few groups may be a result of sampling design. Due to the net
sample being taken from the surface water only, it may be that the rest of the water
column below the surface isn’t accurately represented by the data acquired and that
a group other than the copepoda may be dominant.

Aim;- To assess any changes in phytoplankton along the surface waters of the Fal
Estuary. Also, to distinguish the difference in population and species type of zooplankton,
looking at the most northern riverine station and the most seaward station.
Method;- To asses biological activity within the estuary samples were obtained via
water collect in niskin bottles on the CTD rosette. As the CTD didn’t produce a clear
thermocline, niskin bottles were fired at the top, middle and lower part of the water
column. Samples were stored in glass bottles along with Lugols iodine, to preserve
any phytoplankton species present, and analysed the next day.
A plankton net was deployed and pulled behind the vessel for a period of 5 minutes
to collect a representative sample of the station. Samples were than decanted into
large plastic bottles with formaldehyde added straight after collection to prevent
any additional photosynthesis, growth or predation. By adding formaldehyde at this
stage, the sample is also preserved and ready for analysis and identification within
the lab.
|
Date
|
Station
|
Time (UTC)
|
Location
|
Weather
|
Tide time
|
Tide height/m
|
|
02/07/15
|
67
|
07:59-08:21
|
Lat - 50° 14.390 N
Long - 005° 00.882 W
|
Thick Cloud
8/8 cloud cover
Slight rain
|
High tide 05:04 UTC
Low tide 11:41 UTC
|
4.9
0.7
|
|
|
68
|
08:53-09:00
|
Lat - 50° 13.325 N
Long -005° 01.606 W
|
Thick Cloud
8/8 cloud cover
Increased rain
|
|
|
|
|
69
|
09:24-09:36
|
Lat - 50° 12.257 N
Long -005° 02.335 W
|
Thick Cloud
8/8 cloud cover
Heavy rain shower
|
|
|
|
|
70
|
09:55-10:11
|
Lat - 50° 10.262 N
Long -005° 02.079W
|
Thick Cloud
8/8 cloud cover
Light showers
|
|
|
|
|
71
|
10:43- 11:31
|
Lat - 50° 07.027N
Long -04° 58.995 W
|
7/8 (beginning to clear)
Very light rain
|
|
|
Table 1 - A table showing the general metadata from Bill Conway

Kemp, A. E. S. and Villareal, T. A., 2013, ‘High diatom production and export in
stratified waters – A potential negative feedback to global warming’, Progress In
Oceanography, 119, 4 – 23.