Home Offshore Pontoon Geophysics Estuary Researchers

Disclaimer: the views and opinions expressed are those of Group 9 members and not necessarily those of the University of Southampton, National Oceanography Centre or Falmouth Marine School

Falmouth Group 9 
2015
Introduction

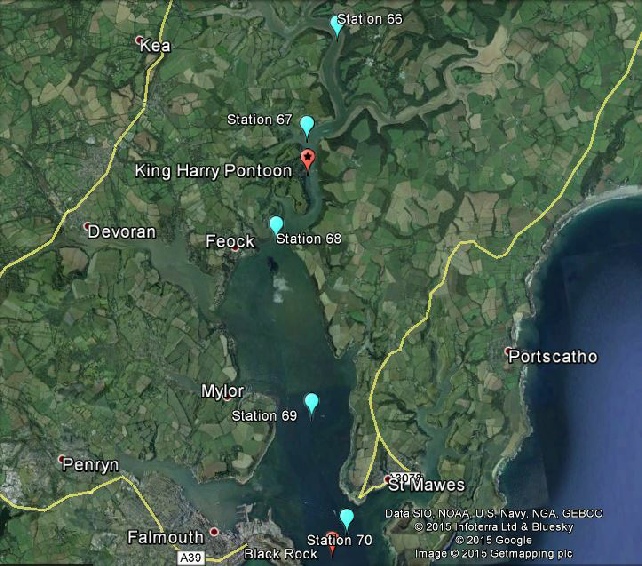
On Thursday 2nd July, group 9 set out on the Bill Conway to collect samples from the Fal estuary. Due to tidal conditions, the first station was located at the most northern point of the estuary and four other stations positioned successively towards the mouth of the estuary (near Black Rock). Sampling conditions were satisfactory, however a sustained rain shower was present each station until station 5, at which precipitation stopped and cloud cover reduced.


AIM: to assess any changes in chemical, physical and biological composition along the Fal Estuary using surface measurements and vertical profiles.


Estuary

Figure 1 - A Google Earth map of the stations sampled for the estuary

Metadata

Date

Station

Time (UTC)


Location

Weather

Tide time

Tide height/m

02/07/15

67

07:59-08:21

Lat - 50° 14.390 N

Long - 005° 00.882 W

Thick Cloud

8/8 cloud cover

Slight rain

High tide 05:04 UTC

Low tide 11:41 UTC


4.9


0.7


68

08:53-09:00

Lat - 50° 13.325 N

Long -005° 01.606 W

Thick Cloud

8/8 cloud cover

Increased rain


69

09:24-09:36

Lat - 50° 12.257 N

Long -005° 02.335 W

Thick Cloud

8/8 cloud cover

Heavy rain shower


70

09:55-10:11

Lat - 50° 10.262 N

Long -005° 02.079W

Thick Cloud

8/8 cloud cover

Light showers


71

10:43- 11:31

Lat - 50° 07.027N

Long -04° 58.995 W

7/8 (beginning to clear)

Very light rain