Disclaimer: the views and opinions expressed are those of Group 9 members and not necessarily those of the University of Southampton, National Oceanography Centre or Falmouth Marine School

Chlorophyll (Fig 1 );-
Surface chl a filtered measurement
The exponential increase can be viewed as a result of heightened light levels occurring around 13:30 and 15:00 (UTC). Between 13:00 and 15:00 (UTC) where chlorophyll increases from 0.616 µg/L to 51.55 µg/L. As the tide ebbed there was a rise in the algal matter surround the pontoon from other regions of the estuary which can account for the growth.

pH (Fig 10);-
Values range from 8.16-
Chlorophyll mg/L (Fig 7);-
A chlorophyll maximum is indicated in each profile at varying depths. Between 13:00-

Figure 5 -

Figure 6 -

O2:
Oxygen readings were collected off the side of the pontoon every 30 minutes with the first profile was taken at 1200 UTC and the final profile taken at 1500 UTC. The YSI probe was deployed at the surface and descended at 1m intervals to the maximum depth. Indicated by the light probe (~5m), the maximum depth was calculated by taking 0.5m’s off the sea bed depth to ensure the probe didn’t reach the sea floor and become damaged.
Chl a:
At the same 30 minutes intervals (1200-
(Acetone value (6ml) / Seawater Volume (50ml)) X fluorometer reading.
Current (Methodology)
A current meter was deployed every thirty minutes off the King Harry Pontoon. The first profile was taken at 1200 UTC and the final profile at 1500 UTC. A surface reading was taken and another reading for every meter until the seabed was reached at approximately 5 meters.
Light (Methodology)
An irradiance probe was deployed every thirty minutes off the King Harry Pontoon. The first profile was taken at 1200 UTC and the final profile at 1500 UTC. A surface reading was taken along with a reading for every meter until the seabed was reached at approximately 5 meters. A ratio (Ez/Eo) was calculated with the irradiance values recorded.
In summary, a range of equipment was used to record and analyse data, collected from King Harry’s Pontoon. A number of trend and observations were made in reference to the estuary’s water column structure.
As the tide ebbs, chlorophyll becomes increasingly more concentrated due a reduction
in volume of water. Increasing irradiance will induce vertical migration of primary
producers, to maximise photosynthesis. Tidal movements and sun exposure both have
a significant effect on water temperature within the estuary. Precipitation and physical
movements, from boats and tidal regimes have an effect on the salinity structure
within the water column. Surface water shows a reduction in salinity during periods
of precipitation. Above 3m, water salinity is more susceptible to disruptions such
as passing boat and the King Harry Chain Ferry. Surface waters of the estuary are
supersaturated, oxygen is then depleted with depth as a result of biological activity.
There is no significant change in pH within the water column profiles with time,
however a slight neutralisation occurs with increasing depth. Anomalies, where water
becomes more alkaline, can occur when the rate of evaporation increases. Changes
in short term weather, e.g. cloud cover and sun exposure, effect irradiance within
surface waters, altering water column ratios (Ez/Eo). At depth there is an increase
in turbidity and resuspension of particles leading to a decrease in irradiance as
less light is available to travel through the water column. Strong surface currents
occur within the water column. The ebb tide has a significant effect on intermediate
waters, increasing current strength that is subsequently reduced towards the sea
bed. Sheer stress at the sea water-

Pontoon
A time series survey was conducted on the Falmouth estuary located at King Harry pontoon, on 26 of June 2015 afternoon. Physical and chemical measurements were obtained at the same time at every half an hour between 12:00 and 15:00 UTC to acquire data over a tidal cycle, totalising 7 tests. Current speed measurements were done with a current meter and light and dissolved oxygen were measured using an YSI probe. Water samples were taken with a plastic bottle and then filtered for later chlorophyll determination on the lab.
AIM – To measure water column characteristics over a tidal regime

YSI
Temperature (Fig 2);-
The general trend shows a decrease of temperature with depth. Profiles 12-
Salinity (Fig 3);-
On average salinity is shown to increase with depth. Strong haloclines can be observed
in profiles 13 and 14 between 2m and 3m. Profiles 8, 11 and 12 have a weaker halocline
located around 1-
Oxygen % and mg/L (Fig 4);-
Oxygen saturation percentage typically decreases with depth. Values range from 118.1% at 14:00(UTC) to 144.2% at 15:00(UTC). Oxygen was also measured in mg/L using the YSI probe. Comparing figure? (O2 mg/L) and figure? (O2 %), profile 11 (13:30 UTC) has a smooth declining trend whereas in figure? (O2 %) there is a sharp decrease in saturation %. This suggests that there is an anomaly at 3m in profile 11. Oxygen within the upper areas of the water is reduced by biological activity, the values of oxygen saturation shows the water to be supersaturated at all profile times.
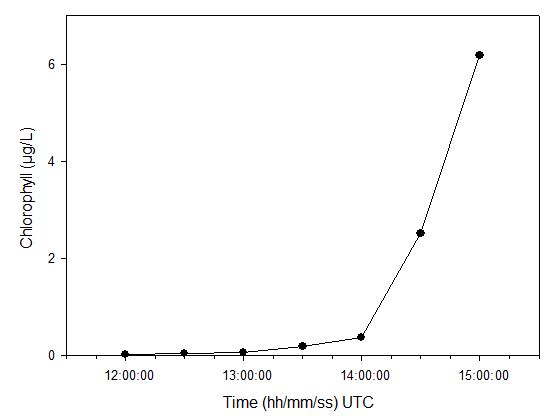
Figure 1 -

Figure 2 -

Irradiance µmol/m2/s (Fig 8);-
Irradiance levels decrease exponentially with depth for each profile. From 1200 to 1330 UTC there was 8/8 cloud coverage and at 13.30 it cleared up to 3/8. This weather change is reflected in the surface values for irradiance with value increasing from 0.36µm at profile 9 to 0.59 µm at profile 14.
Resuspension increases closer to the seafloor due to higher turbidity at the seafloor. This allows less light to travel through the water column decreasing irradiance.
Current m/s (Fig 9) ;-
In surface waters current strength is higher than that found with increasing depth.
However all profiles except 9, show an increase in current around the mid-
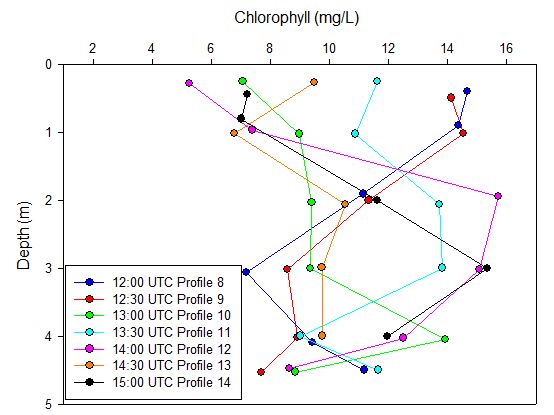
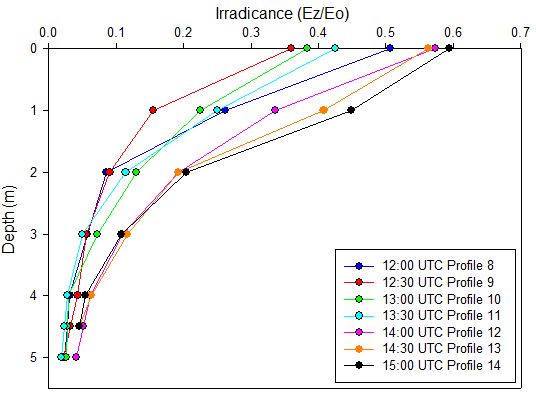
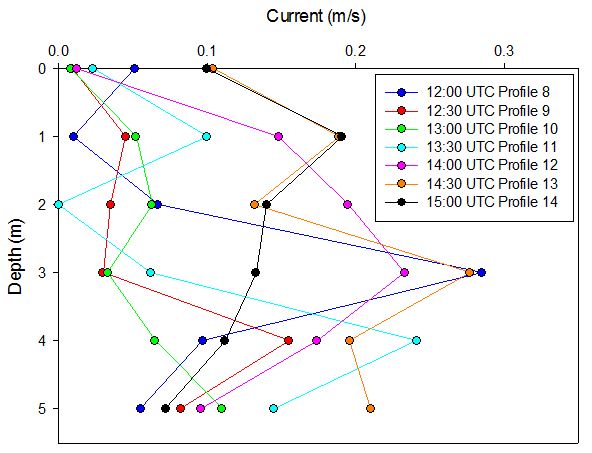

Figure 3 -
Figure 4 -
Figure 7 -
Figure 8 -
Figure 9 -


Figure 10 -
|
Date |
Time |
Location |
Weather |
Tide time |
Tide height/m |
|
26/06/2015 |
1200 – 1500 UTC |
50° 012.570’N 005° 001.390’W |
Between 12:00 and 13:30 UTC was windy with drizzle and cloud cover of 8/8 and after 13:30 the sun came out. |
Hightide: 1209 UTC Low tide: 1841 UTC |
4.1 1.8 |