


|
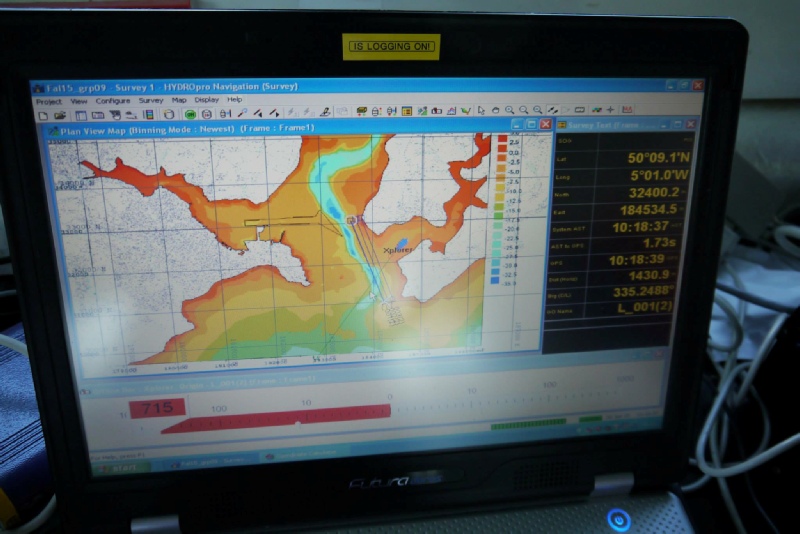
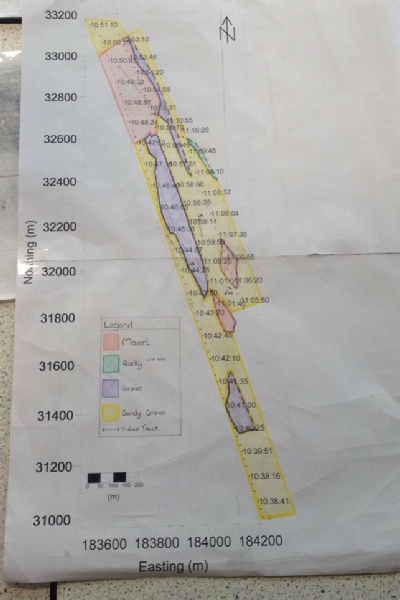
Transect Data |
|
|
Video Data |
|
||
|
1 |
Start Point: |
Eastings: |
0184136.76m |
V1 |
Eastings: |
183563.86m |
|
|
|
Northings: |
0031070.06m |
|
Northings: |
0032942.98m |
|
|
|
Time: |
10:38 UTC |
|
Time: |
12:45 |
|
|
|
|
|
|
|
|
|
|
End Point: |
Eastings: |
0183501.24m |
V2 |
Eastings: |
0184030.49m |
|
|
|
Northings: |
0033149.95m |
|
Northings: |
0031418.42m |
|
|
|
Time: |
10:51 UTC |
|
Time: |
|
|
|
|
|
|
|
Depth: |
31m |
|
2 |
Start Point: |
Eastings: |
0183606.23m |
|
Drift: |
125m |
|
|
|
Northings: |
0033101.43m |
|
|
|
|
|
|
Time: |
10:53 UTC |
V3 |
Eastings: |
0183935.26m |
|
|
|
|
|
|
Northings: |
0032074.49m |
|
|
End Point: |
Eastings: |
0183998.39m |
|
Time: |
12:15- |
|
|
|
Northings: |
0031862.79m |
|
Depth: |
10.5m |
|
|
|
Time: |
11:02 UTC |
|
Drift: |
143m |
|
|
|
|
|
|
|
|
|
3 |
Start Point: |
Eastings: |
0184111.23m |
V4 |
Eastings: |
0183995.06m |
|
|
|
Northings: |
0031829.43m |
|
Northings: |
0032222.12m |
|
|
|
Time: |
11:05 UTC |
|
Time: |
12:27- |
|
|
|
|
|
|
Depth: |
7.5m |
|
|
End Point: |
Eastings: |
0183842.79m |
|
Drift: |
|
|
|
|
Northings: |
0032718.11m |
|
|
|
|
|
|
Time: |
11:10 UTC |
V5 |
Eastings: |
01184096.31m |
|
|
|
|
|
|
Northings: |
0031877.28m |
|
|
|
|
|
|
Time: |
|
|
|
|
|
|
|
Depth: |
20m |
|
|
|
|
|
|
Drift: |
110m |
|
|
|
|
|
|
|
|
|
|
|
|
|
V6 |
Eastings: |
0183835.76m |
|
|
|
|
|
|
Northings: |
0032733.33m |
|
|
|
|
|
|
Time: |
12:37- |
|
|
|
|
|
|
Depth: |
5m |
|
|
|
|
|
|
Drift: |
361m |
|
|
|
|
|
|
|
|
|
|
|
|
|
Note: due to change in order of video data collection and drift, V1 was collected as V6 drifted smoothly towards V1 position. |
||


|
Date |
Time |
Location |
Weather |
Tide time |
Tide height |
|
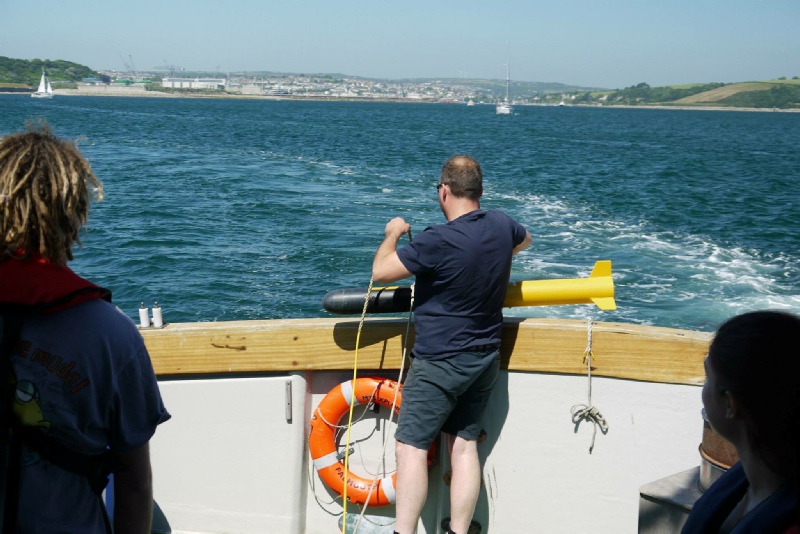
29/06/2015 |
09:38 – 12:45 UTC |
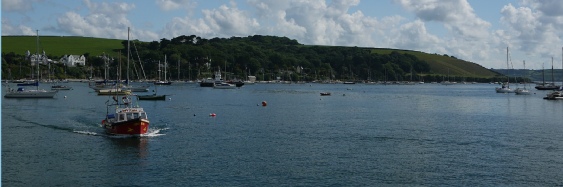
St Mawes |
Clear skies, 0/8 coverage, strong winds causing rough sea conditions |
Low tide: 10:04UTC High tide: 15:54 UTC |
1 4.8 |