Disclaimer: the views and opinions expressed are those of Group 9 members and not
necessarily those of the University of Southampton, National Oceanography Centre
or Falmouth Marine School


NITRATE (Fig 2) ;-
The highest value of NO3 found was 318.9 µmol/L at the point with the lowest salinity
(river end member) with subsequent decrease in concentration with the increasing
salinity. The lowest nitrate concentration value was 1.0 µmol/L at a point with
35.06 salinity on 16.02m depth (Station 70). The mixing diagram shows a non-conservative
behaviour of this nutrient indicating a removal at high salinities. During summer,
the estuary acts as a sink for nitrate (Day et al., 1989), indicating that the removal
presented in the graph could be due to the uptake of nitrate by phytoplankton growth,
since nitrogen is often considered a limiting factor for estuarine phytoplankton
(Adams et al., 2007). Another nitrate sink is denitrification, which takes place
in the water column under conditions of oxygen depletion, or in suboxic or anoxic
sediments (Dähnke et al., 2008). Most of the nitrate is land derived and enters the
estuary via runoff during rain events, so generally the concentrations of this nutrient
will be higher in freshwater than in seawater. Some nutrients enter the estuary from
the ocean; however, their total contribution is much less than that of the fresh
water (Adams et al., 2007).
To attain the data four pieces of equipment were deployed. A CTD rosette with a Niskin
bottles, an ADCP and an plankton net.
To obtain the chemical data a CTD rosette with niskin bottles was used. The samples
were then preserved with 10% Formalin for analysis in the lab.
CHEMICAL ANALYSIS METHODOLOGY - Standard methodology was used for nutrient analysis.
Note that in some cases we refer here to manuals for methods rather than the original
method paper that may have undergone some modifications.
Manual chlorophyll, dissolved Phosphate and Silicon - Parsons T. R. Maita Y. and
Lalli C. (1984) “ A manual of chemical and biological methods for seawater analysis”
173 p. Pergamon.
Dissolved oxygen - Grasshoff, K., K. Kremling, and M. Ehrhardt. (1999). Methods of
seawater analysis. 3rd ed. Wiley-VCH.
Nitrate by Flow injection analysis - Johnson K. and Petty R.L.(1983) “Determination
of nitrate and nitrite in seawater by flow injection analysis”. Limnology and Oceanography
28 1260-1266.
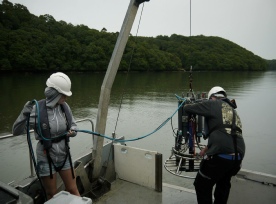
Figure 1 - The CTD during deployment
CHLOROPHYLL (Fig 6)-
The lowest chlorophyll concentration was at a point where one of the lowest salinities
was sampled (Station 67), with a value of 0.912 µg/L for salinity 33.89. However,
the highest value was, 2.568 µg/L, at a point of salinity 33.24 (Station 66), the
most northerly station in the estuary. This behaviour suggests that there is no trend
between chlorophyll and salinity. The chlorophyll concentrations for the highest
salinities of Station 70 (near Black Rock) presented values 1.195 µg/L and 0.991
µg/L for salinities 35.05 and 35.06 respectively. The graphs show peaks between stations,
with a higher chlorophyll concentration in station 66 followed by a lower one in
station 67 and then higher again at station 68 and so on, indicating that phytoplankton
are unevenly distributed. According to Sharples et al. (2001), the growth of phytoplankton
requires sufficient supplies of light and nutrients, therefore high values of chlorophyll
are expected in areas with high freshwater influence, where nutrients are available.
Depth profiles and more sampled stations along the estuary between the sea and river
end members would be required to compare in more detail the differences between a
range of salinities.
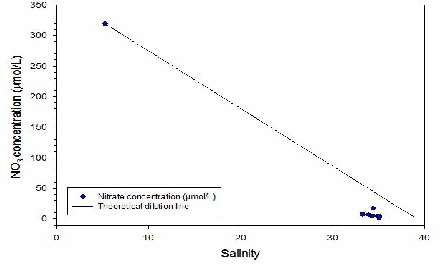
Figure 2 - A graph showing the change in nitrate with salinity at the stations.
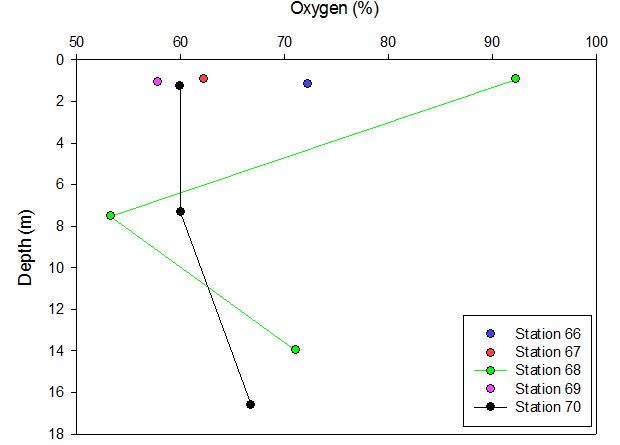
O2 SATURATION (Fig 3);-
Water within the Fal estuary is supersaturated with dissolved oxygen as values within
figure 4 all exceed 100% in each water column measured. At all five Stations measured,
there is a decrease in dissolved oxygen (% saturation) with increasing depth. This
is due to biological activity of primary producers occurring within the estuary.
Water columns closer to the mouth of the estuary have a more varied profile than
those found nearer to the source, indicating that there is an increasing influence
of mixing and biological activity in this area. A significant decrease in oxygen
saturation occurs between Stations 67 and 68 suggesting that there is an increase
in activity from primary producers and other biological organisms such as zooplankton.
Estuary systems that are super saturated in oxygen are classed as net autotrophic
(O’Boyle 2013).
Station 70 displays an under-saturated dissolved oxygen percentage that increases
by approximately 3% from 7-17m. As the depth increases the mixing of water bodies
occurs increasing the percentage of dissolved oxygen in the water column. There is
a high saturation of oxygen in surface waters at Station 68. This could be influenced
by oxygen releases during phytoplankton primary production. There is a decrease in
saturation to 54% at 7.5m possibly due to the absence of primary producers photosynthesising.
Mixing of the surface and deeper waters will allow for oxygen to diffuse to greater
depths as presented in the profile. Stations 69,67 ,and 66 only have surface values.
The oxygen saturation decreases seawards due to the solubility decreasing with an
increased salinity.
Values of dissolved oxygen taken from sampled water (form the niskin bottles), rather
than CTD data, illustrates an opposing saturation structure within the water column.
With continual measurements and the possibility of human and laboratory error, the
values provided by the CTD will be taken as the more reliable data set.
O’Boyle, S., McDermott, G., Nokelegaard, T. and Wilkes, R., 2013, A simple index
of trophic status in estuaries and coastal bays based on measurements of pH and dissolved
oxygen, Estuaries and Coasts, 36, 158 – 173.
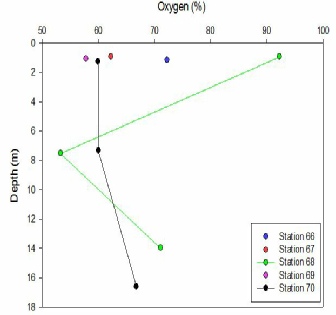
Figure 3 - A graph showing the change in Oxygen saturation with depth at the stations
from niskin bottles
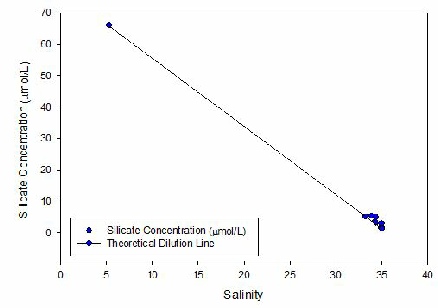
Figure 5 - An estuarine mixing diagram for silicon, with a theoretical dilution line.
Adams, L.G., and G.I. Matsumoto. 2007. Investigating coastal processes and nitrate
levels in the Elkhorn Slough using real-time data. Oceanography. 20(1) p.200–204.
Available online at: http://www.tos.org/hands-on/activities/20.1_adams_mats.pdf (Accessed
July 3, 2015).
Dähnke, K., Bahlmann, E., and Emeis, K. (2008). A nitrate sink in estuaries? An assessment
by means of stable nitrate isotopes in the Elbe estuary. Limnology and Oceanography. 53.
p. 1504–1511.
Day, J.W., Hall, C.A.S., Kemp, W.M. & Yanes-Arancibia, A. (1989). Estuarine ecology.
Wiley, New York. p.145-188.
O’Boyle, S., McDermott, G., Nokelegaard, T. and Wilkes, R., 2013, A simple index
of trophic status in estuaries and coastal bays based on measurements of pH and dissolved
oxygen, Estuaries and Coasts, 36, 158 – 173
Sarmiento, J.L., Gruber, N., Brzezinski, M.A. & Dunne J.P. (2004). High-latitude
controls of thermocline nutrients and low latitude biological productivity. Nature.
427(1). p.56-60.
Statham, P. J., 2012, Nutrients in estuaries - an overview and the potential impacts
of climate change, The science of the total environment, 434, 213 – 227.
Tregeur, P. J., De la Rocha, C. L., 2013, The world ocean silica cycle, Annual review
of marine science, 5, 5, 477 – 501.
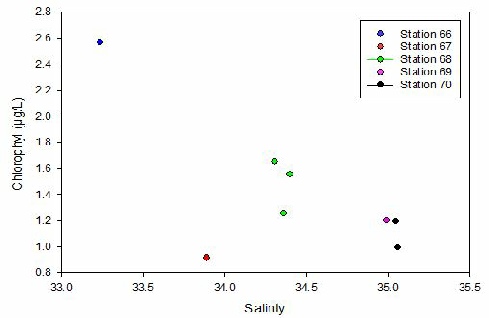
Figure 6 - A graph showing the change in chlorophyll with salinity at the stations.

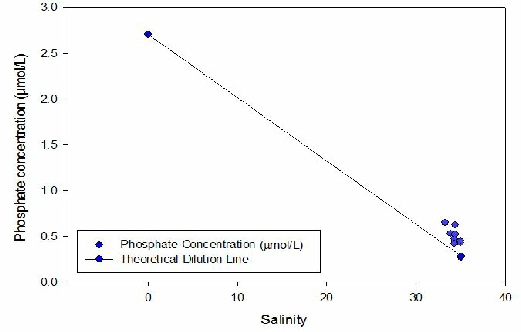
Figure 7 - An estuarine mixing diagram for Phosphate, with a theoretical dilution
line. .
PHOSPHATE (Fig 7) -
As salinity increases, the concentration of phosphate clearly decreases. Joining
the two end-members provides a Theoretical Dilution Line (TDL). Addition of phosphate
to the water column is apparent, as the plotted points are above the TDL. This could
be explained by the leaching of agricultural fertilisers into the river, inputs from
local sewage plants or drainage from old mines [Langston et al, 2006]. The overall
change in phosphate concentration is slight: around 0.4µmol/L, but potentially very
significant. This addition could help to fuel a phytoplankton, specifically diatom,
bloom [Tantanasant et al, 2013].

Water samples were collected from a Niskin bottle on a CTD rosette. From this water,
an oxygen sample was stored in a glass bottle with the addition of manganese oxide
and alkaline iodide. A 100ml sample was collected of filtered water for the silica
sample stored in a plastic bottle and another 100ml for nitrate and phosphate in
a glass bottle, for later analysis.
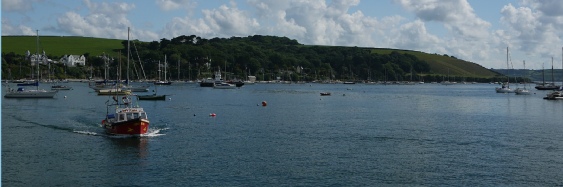
Aim;-The aim of the research trip was to ascertain the differences betwen the upper
and lower estuary
The chemical aim was to assess any changes in Silica, phosphate, nitrate, chlorophyll
and oxygen concentration along the Fal Estuary using surface measurements and vertical
profiles.
|
Date
|
Station
|
Time (UTC)
|
Location
|
Weather
|
Tide time
|
Tide height/m
|
|
02/07/15
|
67
|
07:59-08:21
|
Lat - 50° 14.390 N
Long - 005° 00.882 W
|
Thick Cloud
8/8 cloud cover
Slight rain
|
High tide 05:04 UTC
Low tide 11:41 UTC
|
4.9
0.7
|
|
|
68
|
08:53-09:00
|
Lat - 50° 13.325 N
Long -005° 01.606 W
|
Thick Cloud
8/8 cloud cover
Increased rain
|
|
|
|
|
69
|
09:24-09:36
|
Lat - 50° 12.257 N
Long -005° 02.335 W
|
Thick Cloud
8/8 cloud cover
Heavy rain shower
|
|
|
|
|
70
|
09:55-10:11
|
Lat - 50° 10.262 N
Long -005° 02.079W
|
Thick Cloud
8/8 cloud cover
Light showers
|
|
|
|
|
71
|
10:43- 11:31
|
Lat - 50° 07.027N
Long -04° 58.995 W
|
7/8 (beginning to clear)
Very light rain
|
|
|
Table 1 - A table showing the general metadata from Bill Conway

SILICON (Fig 4) -
The estuarine mixing diagram for silicon shows both the data points and the theoretical
dilution line (TDL). The TDL shows where the silicon concentration would be expected
to plot if only conservative mixing occurred in the estuary. Even when discounting
the furthest right data point (with a salinity of 38) the general trend of the data
points appear to be above the TDL. Data points above the TDL show addition of silicon
to the system. However due to the recent dry weather, and evaporation occurring at
the estuary surface, there is a narrow range of salinities. One cannot assume that
addition occurs throughout the whole estuary, it may only start at a certain part
– for instance near to mines. Silicon enters estuaries by lithogenic input – rocks,
mining is a suitable way for this addition to occur (Treguer, 2013). This net addition
along the estuary is a surprise as during the summer, when sampling occurred, there
are high numbers of diatoms present. Diatoms remove silicon to form opal (Statham,
2012).
Figure legend
Estuarine mixing diagram for dissolved silicon along the Fal estuary. N=7. The riverine
end member was calculated from a sample obtained separately near Truro.
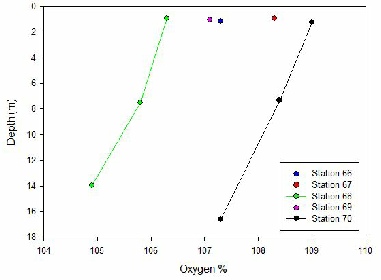
Figure 4 - A graph showing the change in Oxygen saturation with depth at the stations
from the CTD