The offshore waters around Falmouth in the English Channel exhibit well stratified
waters in the summer months when wind mixing is decreased and warming from the sun
causes a thermocline to be formed which in turn leads to the depletion of surface
nutrient levels. However, tidal forces interacting with shallower waters closer to
shore cause nutrients to be forced to the surface and a tidal mixing front to appear.
Therefore, the aim of the offshore boat work was to investigate these vertical mixing
processes and how they affect the structure and varying abundances of plankton communities,
both directly and indirectly.
In order to answer this aim, a survey plan was constructed with the overall objective
of measuring physical, biological and chemical data both in well stratified waters
and waters where this stratification breaks down either side of the tidal mixing
front.
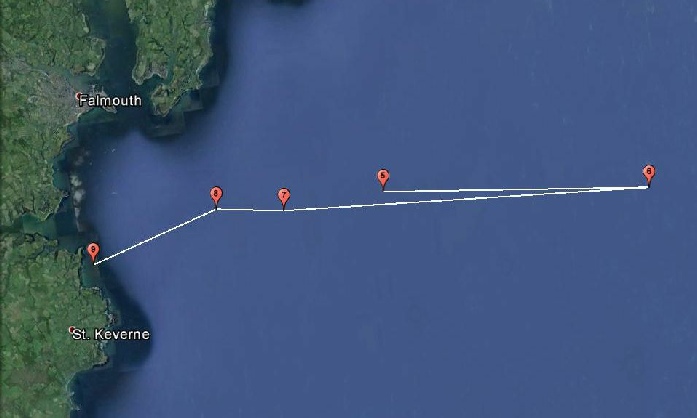
The survey was conducted on 24th June 2014 on the vessel the RV Callista, beginning
at 07:13 UTC and finishing at 17:05 UTC. Due to the weather conditions being optimal
(minimal cloud cover and calm waters) the Callista was able to go as far out to sea
as we required for the survey. This meant, the original objective could be pursued
without modification due to adverse weather conditions. Due to the previous group
undertaking an overall survey that extended from the south-east to the shore in the
north-west, it was decided that we would conduct a survey extending from the shore
on the west to a station further out to sea in the east and to see whether the tidal
mixing processes were similar.
The first station of the day was a standard station that most groups attempted to
sample and due to its location fairly out at sea exhibited a fairly strong thermocline.
Due to the consistent naming method enforced over all groups and the fact we were
sampling on the second day of offshore work, this station was designated as Station
5 in our data collection. It was decided that the second station, Station 6, would
be taken directly east from the compulsory station in order to sample waters with
an obviously strong thermocline. The AADI profiles generated underway were consulted
to ensure that the waters sampled fitted what we wanted to see in them. At both Station
5 and Station 6 bottles were fired from the CTD at the top and bottom of the water
column in order to get an idea of how variables in the seawater change in its entire
depth. Bottles were also fired at the chlorophyll maxima and within the thermocline
in order to get an idea of the associated biology and chemistry. Due to the fact
that the transmissometer on the CTD was broken, secchi disks were used to approximate
attenuation of light and turbidity instead. Zooplankton nets were deployed above
and below the chlorophyll maxima at both stations to give some idea of how the zooplankton
was distributed in the water column.
With the well stratified waters sufficiently sampled, the next step of the survey
plan was to head westwards and begin to sample waters closer to and around the tidal
mixing front. Due to the fact it would very difficult to judge exactly where the
tidal front was located purely from the underway AADI data, Stations 7 and 8 were
chosen as points thought to be sufficiently close to shore so as for mixing to begin
to be observed. At Station 7, the chlorophyll maxima peak was very widely spread
in the vertical and whilst the CTD bottles were fired in the same way as in Stations
5 and 6, the zooplankton trawl was taken up the whole water column sampled at once
due to the lack of a clear distinction above and below the chlorophyll maxima. The
CTD was dipped at Station 8 but the profiles generated were too similar to those
observed at Station 7 to warrant a full sampling and so bottles were not fired and
the zooplankton net was not deployed.
On advice from the boat’s skipper, who said the tidal front was present at a water
depth of around 30m the previous working day, the boat progressed further westwards
to a point where the water depth was below 20m to ensure that the tidal front had
been crossed and mixed waters were being sampled. Station 9 therefore fit these criteria
and a full sampling procedure was observed, with the CTD bottles being fired throughout
the water column to give a representative set of data and the zooplankton net being
deployed through the entire water depth due to the well mixed nature of the water.
All of the relevant metadata for each station is in Table 2.0.1 and an overall map
of the day’s survey is shown in Figure 2.0.1


