

Following a day-
The Richardson number is a dimensionless number expressing the ratio of potential to kinetic energy and is used to describe the flow characteristics of a given water column. Flows can be described as turbulent where Ri < 0.25 or laminar where Ri > 1.
Flows ranging between 0.25 < Ri < 1 are considered to have a transitional characteristic and are determined by gravitational shear stress.
Overall all stations show increasing Ri numbers with depth for the top layer (2-


Physics
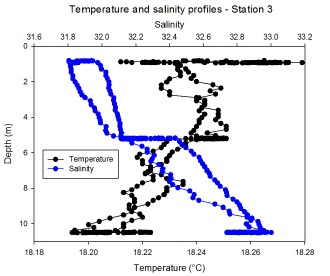
Station 3
This station followed a similar pattern to station 2 but with very constant temperature throughout the water column (18.21°C at surface and 18.20°C at depth) and salinity increase from ~ 32 at surface to 33 at depth.
The flow at this point was very turbulent at surface (Ri < 0.01) and gradually became laminar within 4.5m depth (Ri=0.45). Below that the flow became fairly turbulent again with relatively large fluctuations until it became laminar again at about 8m depth. Below 8m the Richardson number slightly decreased and it is possible that near that bottom it might have decreased further due to shear stress and sediment suspension, although no data has been presented to support that.
Station 4
At this point the temperature of the water column decreased from 18.35°C at surface to 18.11 at ~ 12.5m depth and salinity ranging from 32.8 at surface to 33.6 at depth.
The characteristic of the flow near surface at this station slightly varied from the others however. As mentioned earlier one would expect the flow to steadily become more stable with depth as moving away from wind stress but here we notice a fairly turbulent flow with decreasing Richardson number between 2.5m and 4.5m and then sharply increasing at about 5.2m.
Below that the flow fluctuated but became very turbulent near the bottom, again probably due to strong shear stress with the bottom boundary layer.
Station 6
This station showed the most significant changes in temperature and salinity since the beginning of the survey and here the temperature dropped from 18.4°C at surface to 17.9°C at ~ 15m depth and salinity varied from 32.80 to 34.1.
This station also had a fairly stable flow throughout the column with small drops to turbulence between ~ 6m and 8 to 9m.
At this point it also important to note that measurements took place at 1148 GMT, just one hour before low water (LW: 1247 GMT) and that may explain why the flow was mostly laminar.
Station 7
Here the temperature and salinity of the water column varied less significantly than the previous station with temperatures ranging between 17.7°C at surface and 17.3°C at bottom and salinity varying between 34.7 at surface and 35.01 at about 19.5m.
At this station the flow has been found to be highly turbulent throughout the whole water column, with a small decrease from surface to 5m due to decreasing wind stress but still consistently turbulent.
The fact that the water column was highly turbulent at this station may be suggested by the beginning of the ebb tide at 1247 GMT, which was about the same time the sampling took place at this station.
Also station 6 was located a fair way down the estuary and the strong winds occurring certainly affected the flow characteristics.
Station 8
This was the final station of the estuarine survey and the furthest down the estuary.
Here the temperature and salinity remained mostly constant throughout the water column with temperature of ~ 17.4°C and salinity of ~ 35.4. However the salinity was different on the way down compared to the way up due to the boat drifting.
The flow at this point followed similar pattern to station 6 but with further turbulence and although few high fluctuations it remained very turbulent.
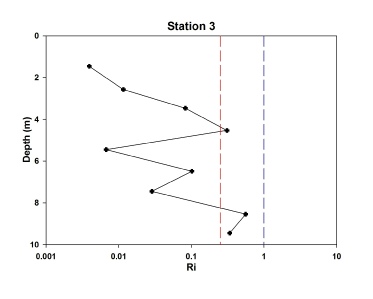
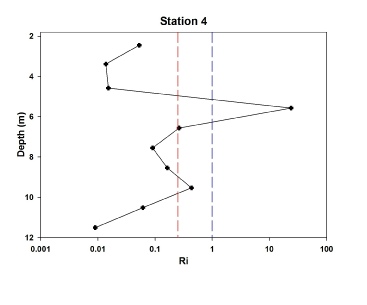
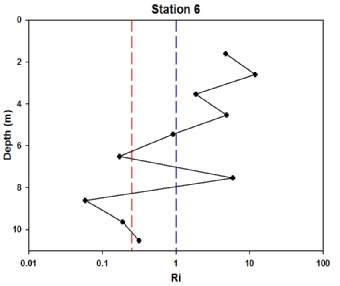
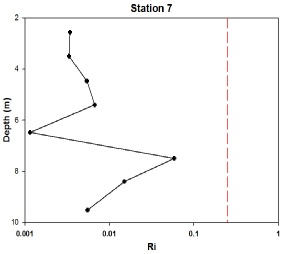
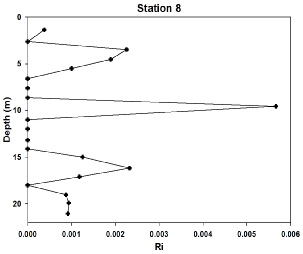
Figure 3.3.6
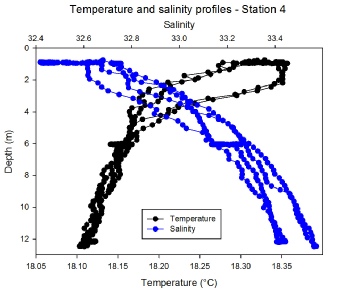
Figure 3.3.8
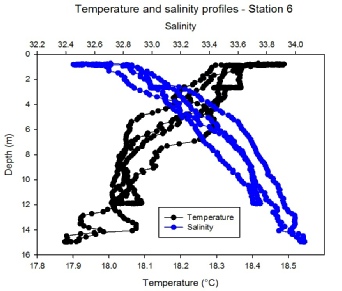
Figure 3.3.10
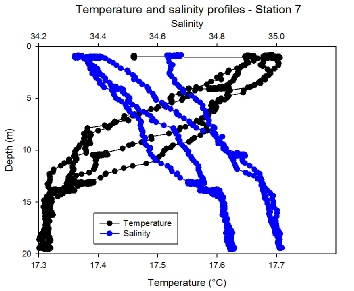
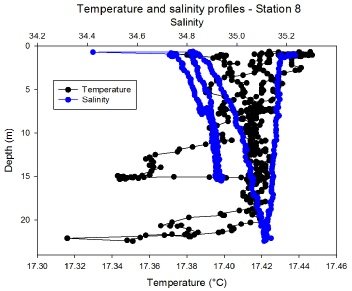
Figure 3.3.7 -
Station 1
According to the data collected from the different instruments this station seems to have a highly stable water column with temperature ranging between 18.3°C
and 18.4°C and salinity ranging between 31.6 at surface and 32 at the bottom. The flow at this point follows typical characteristics of a fairly stable column, with slightly turbulent flow near the surface due to wind stressing and sharply stabilising below 2.5m.
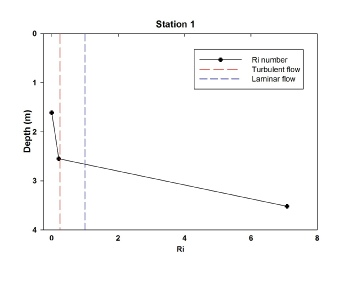
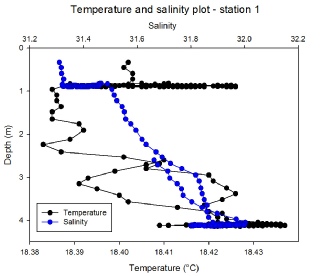
Figure 3.3.2
Figure 3.3.3 -
Station 2
At this station the water column varied slightly with temperatures showing a small increase with depth from 18.1°C at surface to 18.3°C at 9m depth and salinities increasing from 31.6 to 32.6.
While the increase in salinity was expected since this station is situated further down the estuary the small but relevant increase in temperature with depth is something that requires further analysis.
The flow at this station sharply stabilised with depth for the first few metres from surface, as expected due to decreasing wind stress with depth. However between 3 to 5 metres the flow became turbulent and below that fluctuated between 5.5 to 8.5m where it became more stable.
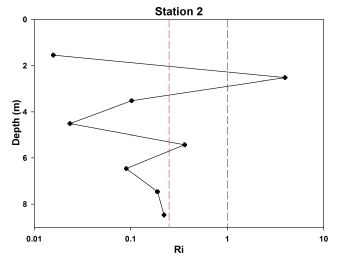
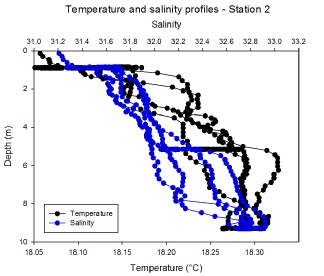
Figure 3.3.4
Figure 3.3.5 -
Figure 3.3.9 -
Figure 3.3.11 -
Figure 3.3.12
Figure 3.3.13 -

Any opinions expressed on this website do not reflect the opinions of the University of Southampton or the National Oceanography Centre
Figure 3.3.14
Figure 3.3.15 -