
Any opinions expressed on this website do not reflect the opinions of the University of Southampton or the National Oceanography Centre


Chemistry
Figure 3.2.4
Figure 3.2.5
Samples were taken from Stations 1 to 8 on RV Conway on 27/06/2014. Water samples
were collected from various depths of interest and then chemically analysed for Nitrate,
Phosphate and Dissolved Silicon concentrations ([![]() ], [
], [ ![]() ] and [
] and [![]() ]). Station 1 was located
at the top of the Fal estuary, i.e. closest to freshwater. Subsequent stations were
situated further downstream at chosen sites, with station 8 being closest to the
mouth of the estuary.
]). Station 1 was located
at the top of the Fal estuary, i.e. closest to freshwater. Subsequent stations were
situated further downstream at chosen sites, with station 8 being closest to the
mouth of the estuary.
Due to the estuarine location we would expect nutrient concentrations to be greater,
at least in the surface water, the further up-
Nitrate Concentration vs. Depth
Stations 1, 2, 3 and 6 all show a continual decrease in [![]() ] with depth. Stations 1,
2 and 3 start with values near 20 µmol.L-
] with depth. Stations 1,
2 and 3 start with values near 20 µmol.L-![]() ] from start to finish with some deviation
in the mid-
] from start to finish with some deviation
in the mid-![]() ]. Station
4 decreases but then has a slight increase to a level less than that of the surface
concentration. Station 3 had the largest concentration of any station with around
18 µmol.L
]. Station
4 decreases but then has a slight increase to a level less than that of the surface
concentration. Station 3 had the largest concentration of any station with around
18 µmol.L

Figure 3.2.1
Phosphate Concentration vs. Depth
Relatively conservative behaviour is illustrated at stations 3, 4, 7 and 8 below
5m from the surface. Station 7 shows a decrease in [![]() ] from the surface to 5m depth.
] from the surface to 5m depth.
Station 1 shows a decrease in [![]() ] from 0 – 5m with [
] from 0 – 5m with [![]() ] values of 0.4 -
] values of 0.4 -![]() ] to ≈2.5m with a value of 1.2 µmol.L-
] to ≈2.5m with a value of 1.2 µmol.L-

Figure 3.2.2
Dissolved Silicon Concentration vs. Depth
Station 1, 6 and 8 show a relatively conservative distribution with depth but at
differing concentrations; around 6 µmol.L-
Stations 2, 3 and 4 show a near continuous decrease of dissolved silicon concentration
with depth, with station 2 having the largest range of 16 to 0 µmol.L-
Station 6 shows an increase with depth of around 1 µmol.L-

Figure 3.2.3
Station Number vs. Silicon and Diatom Abundance
A silicon concentration of 16 µmol.L-
Diatom abundance decreases marginally from station 1 to station 3, 7e5 L-
It seems evident that as diatom abundance increases, the dissolved silicon concentration decreases and, when dissolved silicon concentration hits a certain low level, the diatom abundance rapidly depletes. Factors such as turbidity and salinity could also create anomalies shown in this graphical data.


Station Number vs. Nitrate and Dinoflagellate Abundance
[![]() ] undulates initially, peaking at station 3 with around 18 µmol.L-
] undulates initially, peaking at station 3 with around 18 µmol.L-
The Dinoflagellate population is initially low, with little undulation at stations
1 to 6. Station 7 illustrates a large peak (60 000.L-![]() -
-
Introduction
Mixing Diagrams
Mixing diagrams have been created for Phosphate, Nitrate and Dissolved Silicon. These
diagrams show the Theoretical Dilution Line (TDL) joining the riverine and sea end-
Dissolved silicon appears to follow the TDL quite uniformly with no real variation until greater salinities (>30) are reached. This is due to the utilisation of dissolved silicon by diatoms for the formation of frustules.
![]() has anomalies in the data that suggests nitrate is being removed from the estuary.
has anomalies in the data that suggests nitrate is being removed from the estuary.
![]() again has some indication of removal, however there are some outlier data points
above and below the TDL. Due to insufficient numbers of outliers, they cannot be
directly interpreted.
again has some indication of removal, however there are some outlier data points
above and below the TDL. Due to insufficient numbers of outliers, they cannot be
directly interpreted.
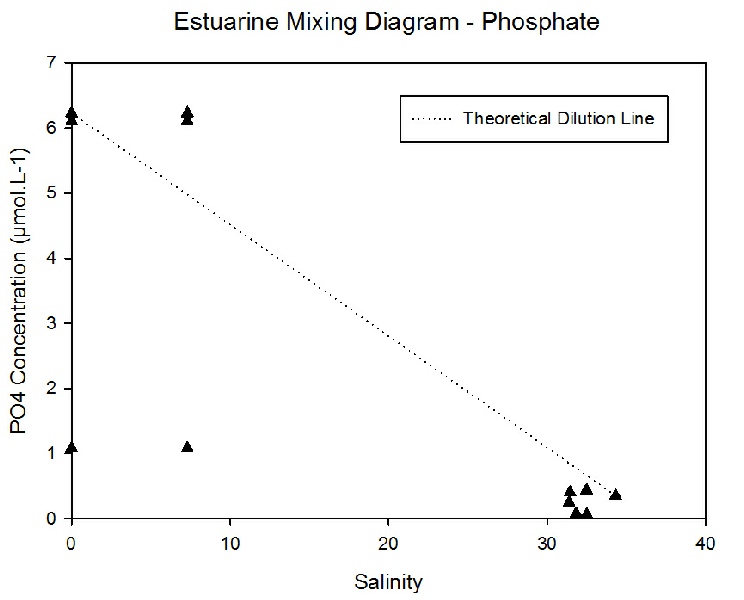
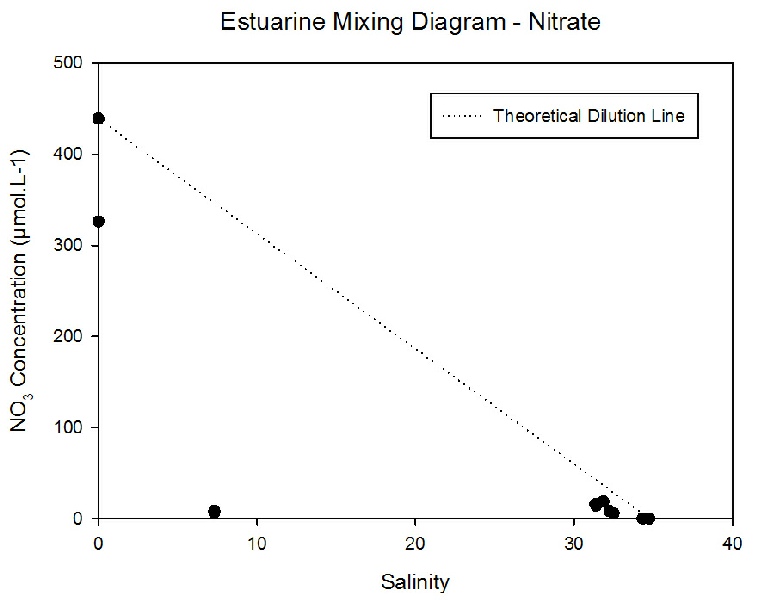
Figure 3.2.6
Figure 3.2.7
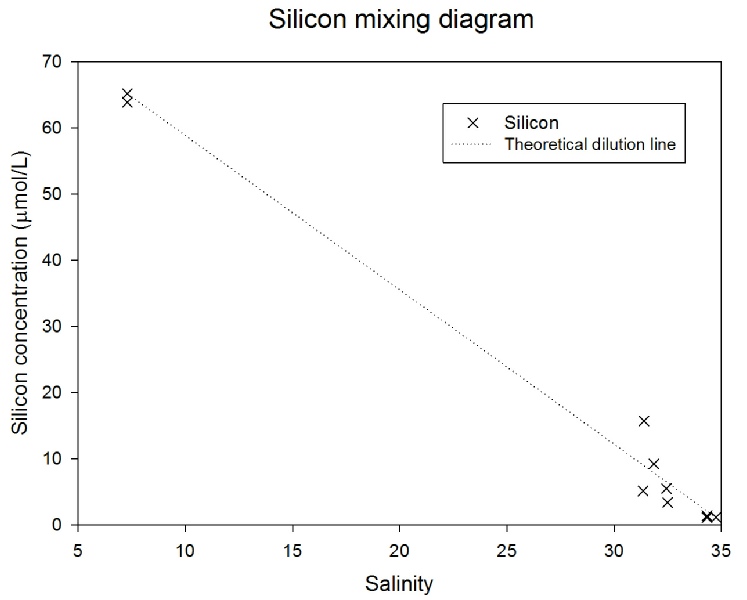
Figure 3.2.8