
Any opinions expressed on this website do not reflect the opinions of the University of Southampton or the National Oceanography Centre
Phytoplankton

Biology
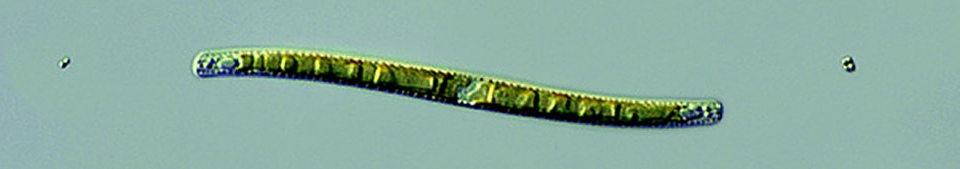
Phytoplankton exhibit a varying distribution across all stations, but the group that dominates in almost all stations are the diatoms, and specifically the species Leptocylindrus danicus. As can be seen in Figure 2.1.2, at Station 6 L. danicus constitutes over 50% of the total phytoplankton population and almost that amount at Station 5 (Figure 2.1.1). In terms of relative abundance, L. danicus dominates the most at Station 9 (Figure 2.1.4) which is the closest to shore and so beyond the tidal front. The cosmopolitan nature of this diatom throughout coastal waters explains why it is found in such high abundances both close and far from shore (Horner, 2002).
The only location where diatoms were not the dominant phytoplankton species was at Station 7 where the dominant species were Dinophysis spp.; which are dinoflagellates (Figure 2.1.3). This was a Station approaching the tidal front but not yet crossing it and so mixing was starting to increase and the stratification of the waters beginning to break down. Therefore, the fact that this abnormally high dinoflagellate result is not repeated in other Stations could be due to dinoflagellate blooms that occur close to the tidal front along the isopycnal on the warmer side of the front (i.e. seawards) (Franks et al., 1989).
At Station 9, the station closest to shore, L. danicus forms the largest proportion of phytoplankton out of all stations (Figure 2.1.4) and the highest #/L, with 345,000 / L (Figure 2.1.4) compared to the next highest value at Station 6 of 175,000 / L (Figure 2.1.2). This exceptionally high diatom count coincides with increased silicon levels in the water column (see Figure 2.2.1 on the Offshore Chemical Page).

Figure 2.1.1

Figure 2.1.2

Figure 2.1.3

Figure 2.1.4
Zooplankton
The most obvious zooplankton group present from both the microscope lab work and subsequent graphs are the hydromedusae jellyfish. They are the most abundant zooplankton group overall (Figure 2.1.9) and the most abundant zooplankton group both at Stations 5 (Figure 2.1.5) and 6 (Figure 2.1.6). Their high abundance in the coastal waters around Falmouth could be indicative of climate change resulting in warmer waters more conducive to jellyfish growth (Purcell, 2005).
Cladocera is a zooplankton group that peaks in its relative abundance at Station
7 (839.11/L) (Figure 2.1.7). This Station is the only point at which cladocerans
are the dominant zooplankton group, all other stations either have hydromedusae,
copepods or decapoda larvae as the dominant zooplankton group. This could be due
to in situ environmental conditions that sometimes allow cladocerans to out-
Although the dominance of hydromedusae is obvious at the stations further out to
sea (Stations 5 and 6), Station 9 (the one closest to shore) exhibits copepods as
the zooplankton group with the highest abundance (277.78/L) (Figure 2.1.8). This
is more in line with learned expectations of zooplankton group abundances in coastal
waters (although of course recent surges in jellyfish growth are starting to change
this thinking. The high abundance of copepods here is likely due to the concurrent
high abundance of diatoms (specifically L. danicus) (Figure 2.1.8); high diatom populations
generate a trophically related high copepod population (Irigoien et al., 2002). Station
9 overall shows a more even distribution of the variety of zooplankton groups rather
than one group dominating (Figure 2.1.8) which could be due to greater availability
of nutrients beyond the well-

Figure 2.1.5

Figure 2.1.6

Figure 2.1.7

Figure 2.1.8

Figure 2.1.9
Horner, R. A. 2002, ‘A Taxonomic Guide To Some Common Phytoplankton’. Biopress Limited, Dorset Press, Dorchester
Bosch, H. F. and Taylor, W. R. 1973, ‘Distribution of the cladoceran Podon polyphemoides in
Chesapeake Bay’, Marine Biology, 19, 161-
Franks, P. J. S., Anderson, D. M., and Keafer, B. A. 1989, ‘Fronts, upwelling and
coastal circulation: spatial heterogeneity of Ceratium in the Gulf of Maine’ Red
Tides: Biology, Environmental Science and Toxicology, Elsevier, New York, 153-
Irigoien, X., Harris, R. P., Verheye, H. M., Joly, P., Runge, R., Starr, M., Pond,
D., Campbell, R., Shreeve, R., Ward, P., Smith, A. N., Dam, H. G., Peterson, W.,
Tirelli, V., Koski, M., Smith, T., Harbour, D. and Davidson, R. 2002, ‘Copepod hatching
success in marine ecosystems with high diatom concentrations’, Nature, 419, 387-
Purcell, J. E. 2005, ‘Climate effects on formation of jellyfish and ctenophore blooms’,
Journal of the Marine Biological Association of the United Kingdom, 85, 461-