Home Offshore Estuary Pontoon Geophysics

Any opinions expressed on this website do not reflect the opinions of the University of Southampton or the National Oceanography Centre


Estuaries are important mixing points between rivers and the sea, the system in the Fal estuary is influenced by several riverine inputs which are fundamental to natural and anthropogenic nutrient input. The rate of addition or removal of these nutrients is influenced by the amount of riverine input and the rate of tidal flushing within the estuary, and their presence can be quantified to demonstrate conservative or non-conservative chemical processes within the estuary.

The varying density, temperature and salinity of the different water types present leads to changes within the water column structure throughout the estuary.

The arrangement of all these factors determines the type of biological processes occurring within the estuary, which can be observed by the type of phytoplankton and zooplankton present within the water body.

Table 3.0.1 - Estuarine Stations


Site No.

Latitude

Longitude

Time (UTC)

Depth (m)

Air Temp (°C)

Secchi Depth (m)

Wind Speed (ms⁻¹)

Wind Direction (°)

1

50° 14.391' N

005° 00.890' W

09:20

6.5


1.26

2.6

207.4

2

50° 13.501' N

005° 00.933' W

10:07

11.4


1.72

1.9

227.2

3

50° 13.328' N

005° 01.614' W

10:35

13.2

18.3

1.85

4.8

200.3

3R

50° 13.329' N

005° 01.614' W

10:52

12.6

18.2


4

50° 12.940' N

005° 01.571' W

11:20

14.6

18.3

1.67

3.1

226.5

5

50° 12.574' N

005° 01.664' W

11:35

4.2

18.7


6

238.1

6

50° 12.436' N

005° 01.749' W

11:48

17.8

18.5

1.8²


7

50° 10.250' N

005° 01.942' W

12:31

22.8

17.7

2.9³

9.1

227.1

8

50° 08.652' N

005° 01.407' W

13:17

30¹

17.4

6.7

6.4

226.7

¹ Echosounder difficulties, estimated 30m from ADCP data

² at 50 12.451 N, 005 01.742 W, 12:00 UTC

³ at 50 10.358 N, 005 01.838 W, water depth 19.8m, 12:43 UTC

⁴ at 50 08.577 N, 005 01.364 W. Total depth 18.2m, 13:32 UTC


Estuary

Click to enlarge.

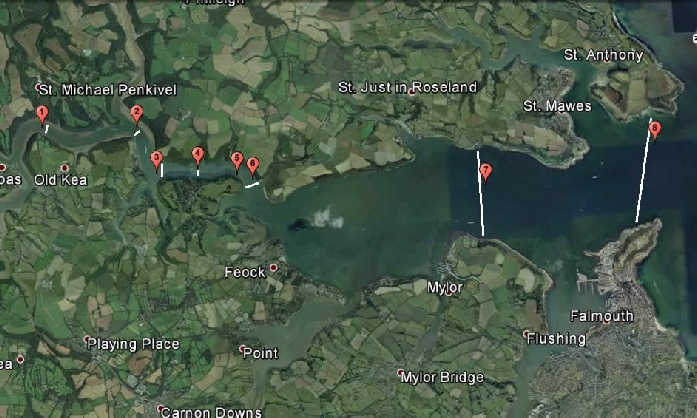
Figure 3.0.1 - Location of stations and ADCP transects.

Aim

To determine how the physical, chemical and biological parameters change with distance down the estuary.

Method

On the 27/06/2014 between 09:20-14:00 UTC group 11 and group 5 travelled down the estuary aboard the Bill Conway research vessel. Group 11 worked on the upper to middle estuary (stations 1-4) and group 5 took over at 11:11 UTC from the King Harry pontoon completing stations 5-8 from the mid estuary to seaward end-member.

Station 5 was a training station and no measurements were taken here.

At each station a vertical CTD was taken providing temperature, salinity, fluorescence and transmission data vertically through the water column. The CTD Rosette held Niskin bottles which were fired at the deepest possible depth for the Rosette to be safely lowered too (determined by echo-sounder depth, surrounding bathymetry and surface conditions – to avoid damage if we were to drift into shallower water), at the chlorophyll maximum indicated by the CTD readout on board and finally at the surface. Two bottles were fired at each depth in case of any misfires. From these Niskin bottles water samples for nutrient, dissolved oxygen, chlorophyll and phytoplankton were taken.

Once samples were onboard they were labelled and stored following the pre-experimental protocol for which they were required. Secchi disks were also deployed at each station in order to calculate the attenuation coefficient (k) to aid with turbidity measurements.

ADCP transects were completed across the estuary at each station to record flow direction, velocity and backscatter.

At stations 1, 4 and 8 a zooplankton net with a diameter of 50cm and a mesh size of 200µm was deployed for a duration of 5 minutes and the resulting contents bottled, labelled and stored.

Throughout the voyage AADI data which showed surface salinity, temperature and chlorophyll levels was recorded. The data was in effect continuous but saved in sections progressing down the estuary, i.e station 1, travel between station 1 to 2, station 2, etc. enabling segregation of useful station data.

On the 28/06/2014 the samples were then processed in the laboratory with the chlorophyll, phosphate and silicon via the Parsons et al method. The dissolved oxygen using the Grasshoff et al method, and the nitrate via direct flow injection.

Phytoplankton and Zooplankton were identified using microscopes combined with illustrated text books and handouts. The abundance of each species was calculated at each station.