
Any opinions expressed on this website do not reflect the opinions of the University of Southampton or the National Oceanography Centre
Silicon
Figure 2.2.1 illustrates the chemical data collected for dissolved silicon (![]() ) throughout
the water column. There is a general increase in
) throughout
the water column. There is a general increase in ![]() concentration following a slight
decrease between the surface waters and 39 meters. The surface water concentrations
decrease due to diatoms stripping the dissolved silicon to build frustules. The gradual
increase of dissolved silicon with increasing depth, shown in stations 5-
concentration following a slight
decrease between the surface waters and 39 meters. The surface water concentrations
decrease due to diatoms stripping the dissolved silicon to build frustules. The gradual
increase of dissolved silicon with increasing depth, shown in stations 5-
The highest concentrations of ![]() , reaching 1.11 µmol L-
, reaching 1.11 µmol L-![]() and other macronutrients will be expected to be greater at station
9 compared to station 5, 6 and 7.
and other macronutrients will be expected to be greater at station
9 compared to station 5, 6 and 7.


Chemistry
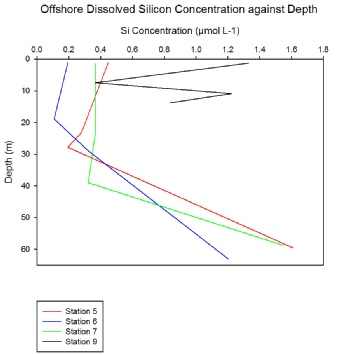
Figure 2.2.1
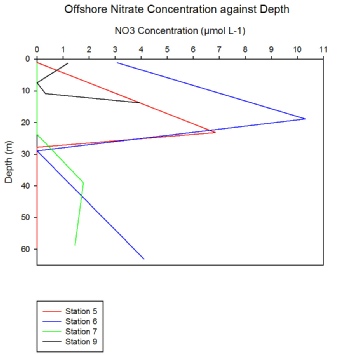
Figure 2.2.2
Phosphate
High concentrations of 0.11 µmol L-![]() ) are found in the coastal waters
around station 9 (see figure 2.2.3). This is due to phosphate being transported into
the oceans via freshwater inputs and weathering of rocks. Furthermore, lower phosphate
concentrations in the deeper, nutrient rich waters of station 6, are depleted from
0.05 µmol L-
) are found in the coastal waters
around station 9 (see figure 2.2.3). This is due to phosphate being transported into
the oceans via freshwater inputs and weathering of rocks. Furthermore, lower phosphate
concentrations in the deeper, nutrient rich waters of station 6, are depleted from
0.05 µmol L-
Chlorophyll and Oxygen
At stations 5-
The only station that does not fit the same pattern is station 9, where chlorophyll and oxygen saturation mirror each other – as chlorophyll increases oxygen decreases. Chlorophyll at station 9 increases with depth reaching a maximum very close to the bottom.
The of fluorescence peak due to higher chlorophyll occur slightly deeper at stations 7 and 8 compared to stations 5 and 6. As the stations get closer to shore the fluorescence peaks become less prominent (see figure 2.2.4).
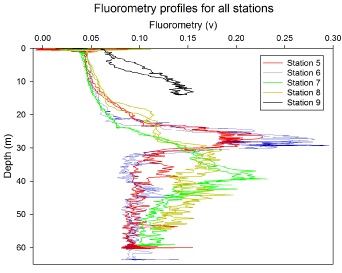
Figure 2.2.4
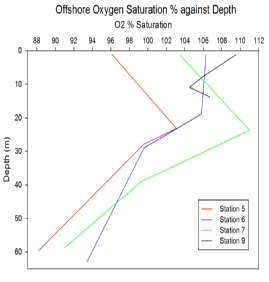
Figure 2.2.5
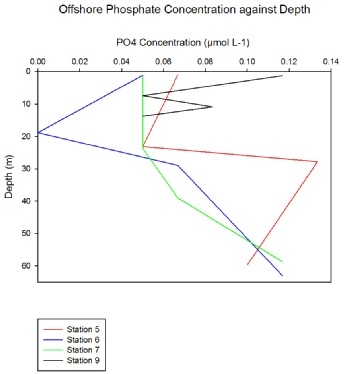
Figure 2.2.3
Nitrate
Nitrate (![]() ) is depleted by phytoplankton between depths of 18 -
) is depleted by phytoplankton between depths of 18 -![]() then decreases
slightly, with increasing depth. This pattern correlates with the chlorophyll concentrations
measured at station 7.
then decreases
slightly, with increasing depth. This pattern correlates with the chlorophyll concentrations
measured at station 7.
Nitrate is depleted rapidly within the top 10 meters of station 9. This could be
due to nitrate being taken up by phytoplankton blooms and becoming a limiting nutrient.
Whereas, higher concentrations of 10.31µmol L-