
Any opinions expressed on this website do not reflect the opinions of the University of Southampton or the National Oceanography Centre

Biology
Phytoplankton samples collected from the voyage were taken to the on shore laboratory
for species identification and abundance calculations using Sedgewick-

Figure 3.1.1 A graph to show the abundance of phytoplankton type at each station travelling down the Fal estuary.
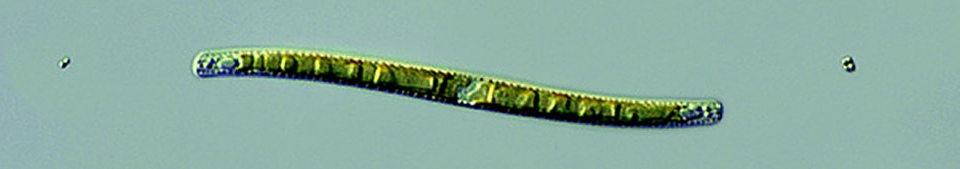
The most abundant type was the diatoms which dominated at every station. The most abundant species was Chaetoceros sp., this species alone (with exception at station 2) had a greater abundance than all the other diatoms, dinoflagellates and ciliates totalled.
The diatoms were found in greater abundance in the upper estuary, between stations
1 and 4, with the peak value being 784,000 individuals per litre at station 4. The
quantity of diatoms then decreases sharply from station 4 to station 6 in the mid
estuary with a 60% reduction in numbers. Between stations 6-
The dinoflagellates were found in lower numbers ranging from 0-
As with the dinoflagellates, the ciliates were found in relatively low numbers with Mesodinium rubrum being the only species found. At station 1, the furthest station upstream 28,000 individuals were found. This figure decreased downriver to station 4 reaching the 4000 individuals. From station 4 to 7 the numbers increased to the maximum of 40,000, then sharply dropped to 1,000 at the seaward end member (station 8). Again like the dinoflagellates this could be due to the weather conditions.
Phytoplankton
Zooplankton
Zooplankton trawl nets with a 200µm mesh were deployed at stations 1, 4 and 8 and towed for 5 minutes at recorded depths. The samples obtained were stored and then species identification and abundance calculated in the laboratory using guide books and Bogorov counting chambers.
Station 1 had a total abundance of 61.78 individual zooplankton, with the most abundant being Hydromedusae totaling 27.3 making up almost half of the total abundance.

Figure 3.1.2 -

Figure 3.1.3 -
Station 4 represented a middle point within the estuary, at this station the total abundance was greatest at 108.91 individuals. Again Hydromedusae were the most abundant group closely followed by Copepods and Copepoda Nauplii with these three groups accounting for 55% of the total abundance. Station 4 had the greatest diversity with 9 different groups although many were in low numbers. The most significant change is the increase in Copepod Nauplii with an increase of 11 individuals, this suggests that the mid estuary has favourable conditions for these developing copepods.
Station 8 was the seaward end member, at this point the number of Hydromedusae is significantly reduced and there are no Copepoda nauplii present. The total zooplankton abundance for this station was the lowest with a total of 53.97 with copepods being the most abundant with 12.70 individuals. There were 8 groups identified showing a greater diversity than station 1, although less individuals.
The decrease in zooplankton numbers is linked in with the phytoplankton abundance as they are the main food source, with the declining silicon at this station leading to less diatoms it is probable that this is the cause for the reduced zooplankton abundance.

Figure 3.1.4 -