
Any opinions expressed on this website do not reflect the opinions of the University of Southampton or the National Oceanography Centre

Physics
At station 5 (figure 2.3.1) salinity is relatively constant throughout the water column at just above 35. Within the first 30m there is a lot of noise and variance from around 35.05 to 35.40. Temperature decreases quite steadily from around 18°C to about 12.3°C within the top 20 meters and then levels off. This is because the sun heats the surface, but the constant salinity indicates that the surface heating is not strong enough to overthrow tidal mixing and to stratify the water column.

Figure 2.3.1

Figure 2.3.2
At station 6 (figure 2.3.2), the furthest station from the shore that was sampled, the temperature drops a little more quickly than at station 5. The salinity varies quite a lot in the top 20 meters (above the thermocline), after this it becomes more stable.
At station 7 (figure 2.3.3), which was closer to shore than station 5, the temperature decreases more slowly, eventually levelling out at around 12.5°C beyond 30m from the surface. The salinity is greatest at the surface probably because of evaporation of the surface water due to heating by the sun but leaving the salts behind. There is a spike in salinity at the main thermocline (about 25m deep), then as the temperature levels out the salinity also becomes less variable.

Figure 2.3.3

Figure 2.3.4
At station 8 (figure 2.3.4) salinity is again highest at the surface, but after this varies very little through the water column temperature drops from 20°C to 12.7°C fairly steadily but with the fastest change occurring in the top 25m this change from defined thermocline in the previous stations is probably due to increasing effect of tidal mixing as the stations get closer to the shore.
Station 9 (figure 2.3.5) is the shallowest site and the closest to shore. However, there are two distinct profiles for tempreature. This is likely due to the drifting of RV callista, and thus raising equipment in a different location.

Figure 2.3.5
Temperature and Salinity
Watercolumn Stability - The Richardson Number
The Richardson number (Ri) is a ratio of the density gradient (stabilising effect) to the velocity shear (destabilising effect). If Ri > 1 the flow is described as laminar, if Ri < 0.25 flow is described as turbulent.
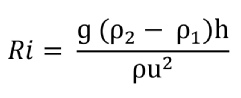
Equation 2.3.1
At stations 5-


Figure 2.3.6 -