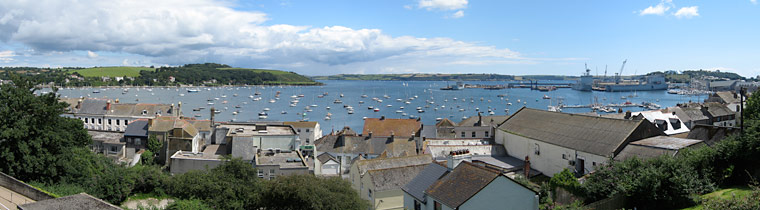
A) Zooplankton community structure Station 1
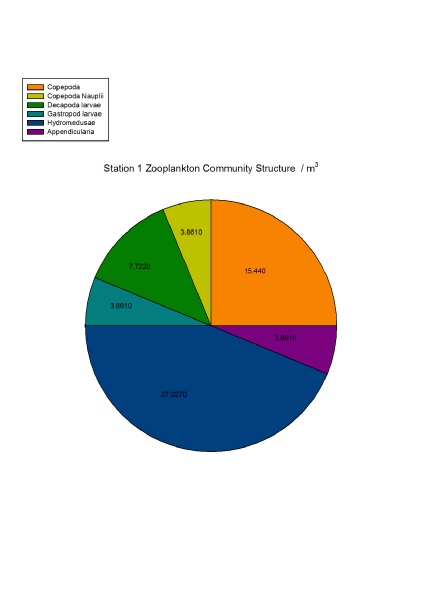
B) Zooplankton community structure Station 4
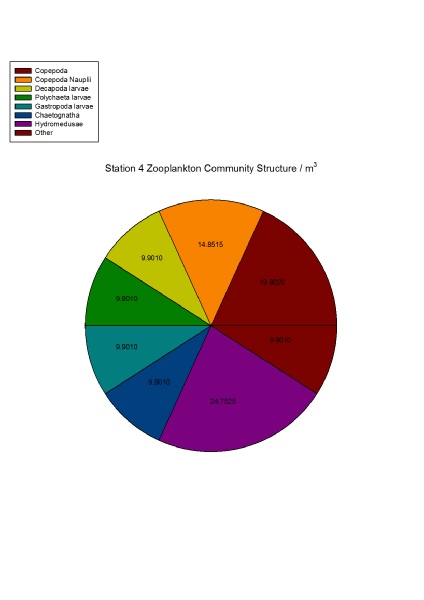
C) Zooplankton community structure Station 7
Figure 10 A-
(Click individual graphs to enlarge).
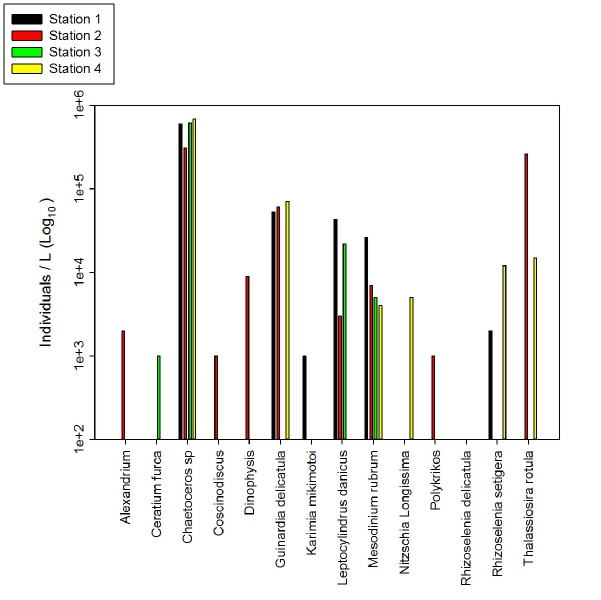
A) Abundance of Phytoplanton species stations 1-
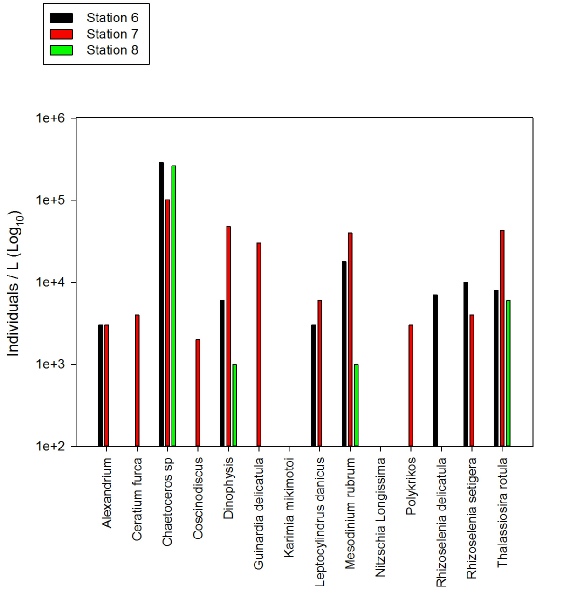
B) Abundance of Phytoplankton species stations 5-
Figures 12 A and B Illustrate the abundance of Phytoplankton species at each station along the Fal Estuary and subsequent river. Data taken on the 27/06/2014 between 07:20 and 12:22 UTC
(Click individual graphs to enlarge).
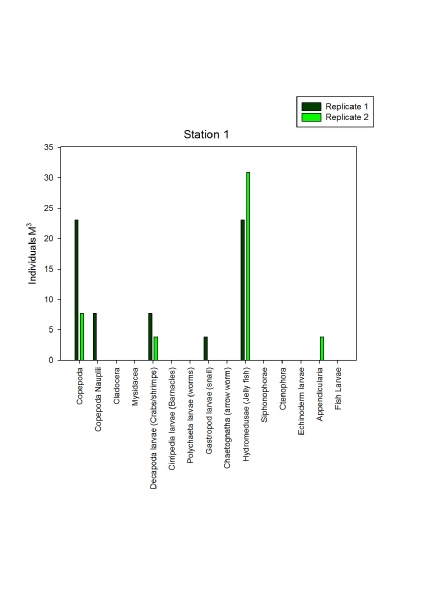
A) Abundance of Zooplankton species at station 1
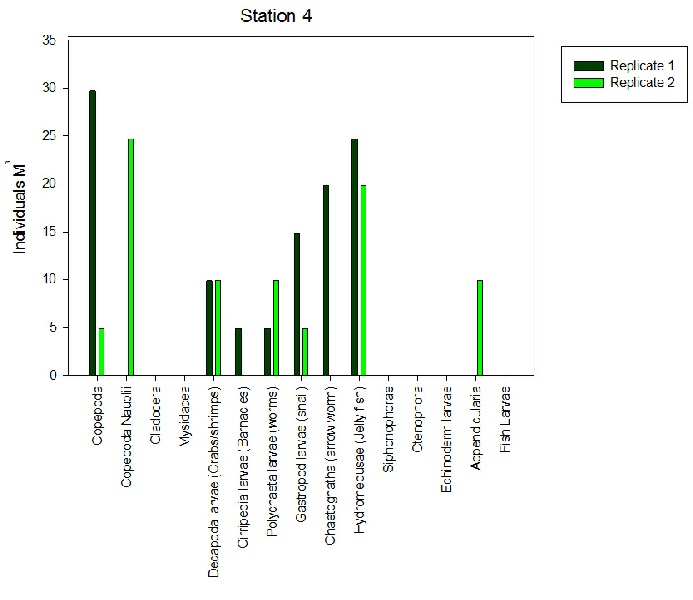
B) Abundance of Zooplankton species at station 4
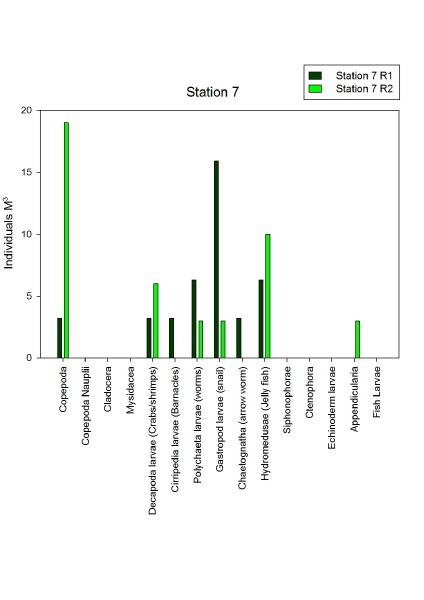
C) Abundance of Zooplankton species at station 7
Figures 11 A-
(Click individual graphs to enlarge).
Samples collected from station 1 (Figures 10A and 11A), located within the upper reaches of the estuary, exhibit a dominance of hydromedusae and copepods (32 and 24 individuals per m3 respectively) with few other groups being noted as being present. At station 4 (Figure 10B and 11B), it was observed that higher salinities favour greater abundance and diversity within the zooplankton community, with most groups being represented in numbers upwards of 10 individuals per m3 and no dominant group present. Station 7 (Figure 10C and 11C), taken from beyond the estuary mouth, yielded high numbers of copepods (19 individuals per m3) and hydromedusae (15 individuals per m3), with a reduced abundance of other groups compared to the brackish areas of station 4.
Figures 12A-
Disclaimer -