The chemical, physical and biological properties of the water column in the Western English Channel undergo variations throughout the year. In the winter periods the water column is well mixed, therefore there is no thermal stratification. Nutriclines are not present and plankton abundance is low. In spring and summer increasing temperatures cause the surface layer to warm up causing thermal stratification of the water column. Changes in light intensity cause an increase in abundance of plankton which in turn can cause a depletion of nutrients and nutriclines form.
The aim of this offshore work was to look at the chemical, physical and biological properties at 5 stations to see how they change the further offshore you go. To achieve these aims CTD and ADCP data was collected at each station. Transects were carried out between the stations to collect ADCP data. Niskin bottle samples were taken for chemical analysis and plankton nets for biological analysis.
The CTD was prepared to be lowered by washing and zeroing the transmissometer and ensuring the water sampling bottles were ready to be fired. It was then deployed and left at the surface for 30 seconds to adjust. It was then lowered slowly down through the water column until it was a couple of metres above the seabed. A niskin bottle was fired at the bottom., a second niskin bottle was fired at the chlorophyll maximum and one at the surface. If we saw something unusual in the CTD depth profile we fired a niskin bottle at that depth as well. The lowering and raising of the CTD was controlled by a winch and the firing of the bottles was controlled by a computer which sent an electrical signal to the CTD. All of this was controlled from on board the ship.
To collect oxygen samples, water was collected from the water sample bottles, into a glass sample bottle. These sample bottles were flushed by overfilling the bottle for 5 seconds before then completely filling the bottle with a sample. The samples then had 1ml Manganous chloride followed by 1ml Alkaline iodine to preserve them while they were stored for lab analysis. The bottle was then closed and it was stored in water to stop any contamination of the sample.
To collect samples for the nitrate, phosphate and silicon water was collected from the sample bottles for each of the different depths. 50ml of the sample was filtered through one filter until 75ml had been collected for silicon and 75 ml for nitrate and phosphate. Three filters were used in total in order to collect the correct volumes. The filters were then placed in 6ml of acetone ready for lab analysis. The sample for silicon was kept in a plastic bottle rather than a glass bottle to avoid contamination of the sample from the silicate in the glass. The sample for phosphate and nitrate was kept in a glass bottle.
A secchi disk measurement was taken at the first station, however at the other station a secchi disk was not done due to currents causing problems with accuracy.
At the stations which displayed a chlorophyll maximum plankton nets were taken. One
was taken through the maximum and a second net was taken from the top of the maximum
to the surface. At station 2(62) the first net was from 40.5m depth to 20m. The second
net was from 20m to the surface. At station 3 (64) 3 nets were taken. The first net
was from 45-
Offshore
Meta Data
Date: 02/07/2014
Time: 07:15-
Location: English Channel
Weather: Cloud cover 1/8
South easterly wind at 9 knots
Tide: Low water-
High water-
Low water-
High water-
Vessel: RV Callista
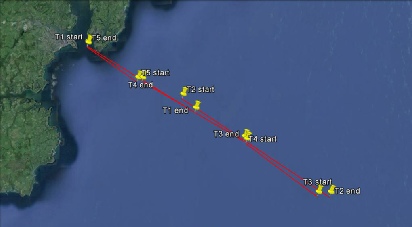
Figure 2-
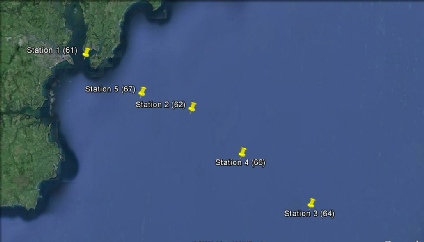
Figure 1-
Water samples were fixed using Lugols iodine. The samples were then reduced down
from 100ml to 10ml. The 1ml was then put onto a Sedgewick-
10ml of the 1 litre sample was taken and put into a Bogorov Counting Chambers. Under the microscope the number of zooplankton was recorded and species were identified. This was then scaled up to calculate the number for the entire sample.
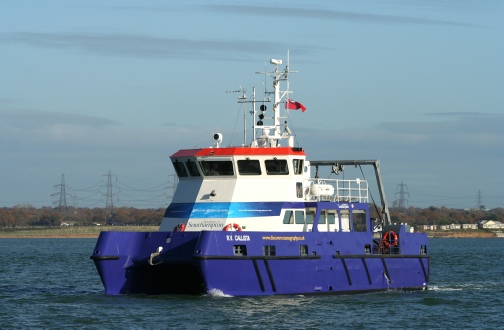
R.V. Callista
Oxygen Analysis
The analysis of the oxygen samples in the lab involved adding 1ml sulphuric acid, which was mixed in using a magnetic mixer, to the oxygen samples that we had collected. This was then analysed using a Winkler Titration System which titrated the sample against thiosulphate.
Nutrient Analysis
Silicon, phosphate and nitrate samples were analysed using standard procedures for sea water (Lohrer et al, 2004).
Chlorophyll Analysis
To analyse the chlorophyll samples each sample was run through a 10 AU flourometer to give a chlorophyll reading per 50ml.
An equation was used to convert the fluorometer reading for chlorophyll, which is
for 6ml, to the total amount of chlorophyll in the 50ml sample.
REFERENCE
- Lohrer, A. M., Thrush, S. F., & Gibbs M.M., (2004), Bioturbators enhance ecosystem
function through complex biochemical interactions, Nature, 431, 1092 -
1095. - Alton, G., 1994, Pinkfroot, [Online], Available:http://my.pinkfroot.com/photo/r-
v- [Last accessed: 4th July 2014].callista- mmsi- 235028893
Disclaimer -
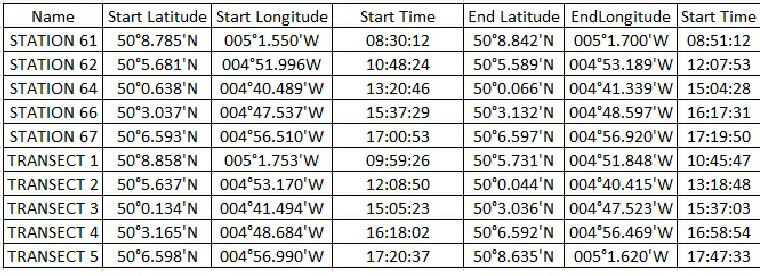
Table showing the location of the stations and transects completed