
Chemical Offshore Results
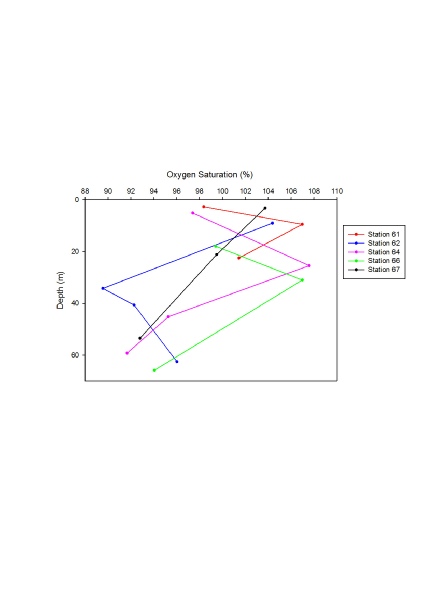
Figure 2-
The oxygen saturation for station 61, 64 and 66 show a similar pattern of an initial increase in oxygen saturation with depth followed by a sudden decrease with depth, with all three of the stations suddenly decreasing in dissolved oxygen concentration between 106% and 108%. Station 61 initially started with roughly 98% dissolved oxygen around 2m, ending at 20m at roughly 101% dissolved oxygen. Station 64 started at roughly 4m at 97% dissolved oxygen and ended at 60m at 92% dissolved oxygen. Station 66 started at 99% dissolved oxygen at 20m and ended at 94% at roughly 68m. Station 62 started at 104% dissolved oxygen at roughly 10m and decreased to roughly 35m at 90%. It then increased to roughly 96% dissolved oxygen at 62m. Station 67 decreased steadily from roughly 3m at 104% to roughly 74m at 93% dissolved oxygen.
A) Station 61
B) Station 62
C) Station 64
D) Station 66
E) Station 67
Figures 1 A-
Disclaimer -
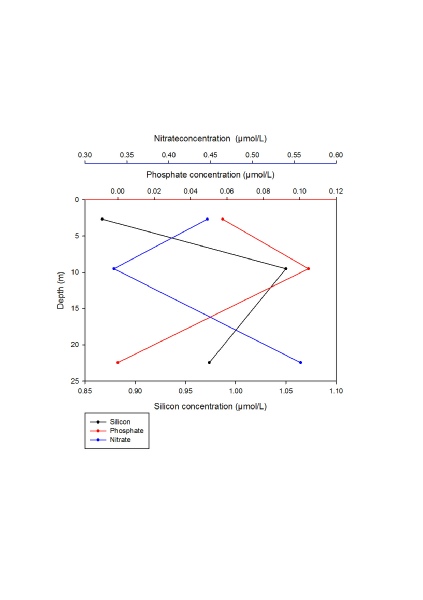
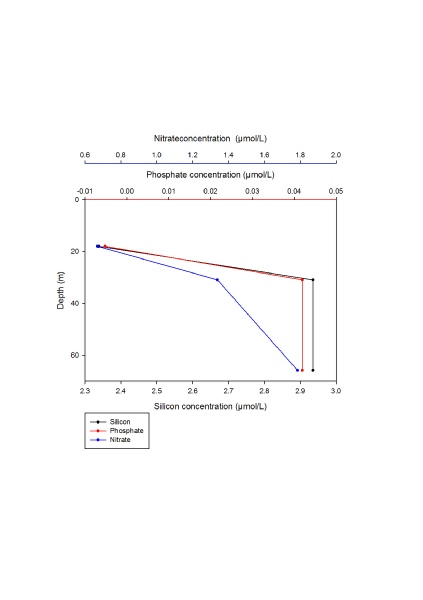
At station 61 (figure 1A) phosphate and silicon increased with depth between the surface and 10m where a maximum for both was recorded. Silicon peaked at around 1.05 umol/L and phosphate at 0.11 umol/. Nitrate, however, decreased between the surface and 9m where a minimum recorded of 0.33 umol/L was recorded. Overall, between the surface and the deepest measured point nitrate and silicon increased whereas phosphate decreased. The decrease in nitrate could be explained by phytoplankton uptake in the surface layer.
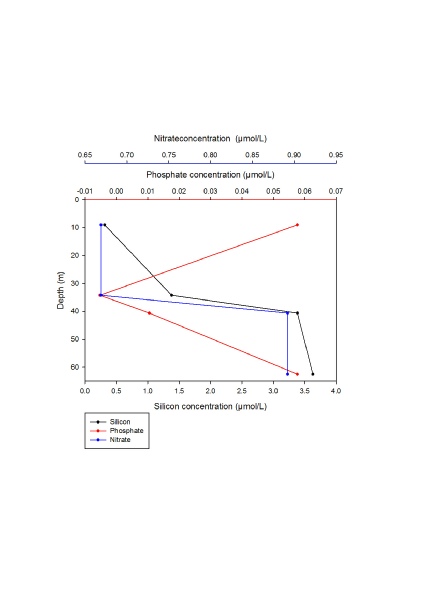
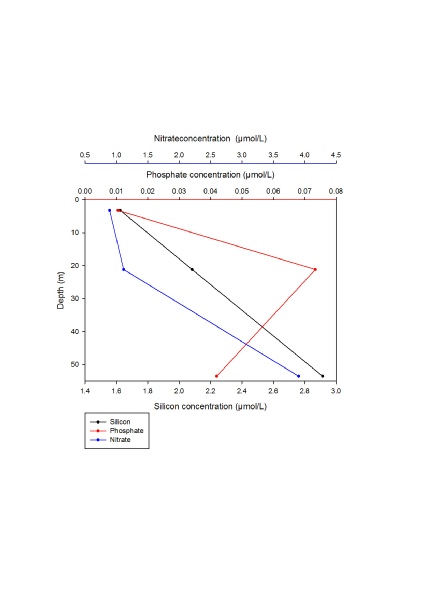
At station 62 (figure 1B) nitrate was stable up to 35m where it increased by 0.23 umol/L within a 2m increase in depth before becoming stable again at around 0.89 umol/L. Silicon increased with depth, increasing by 3.3 umol/L between the surface layer and the bottom. Phosphate experienced a minimum at 35m where silicon and nitrate increased sharply. A reason for the decrease in phosphate could be uptake by phytoplankton in the surface layer. The sharp increase of all nutrients could be explained by the sample being taken below and above the thermoclines.
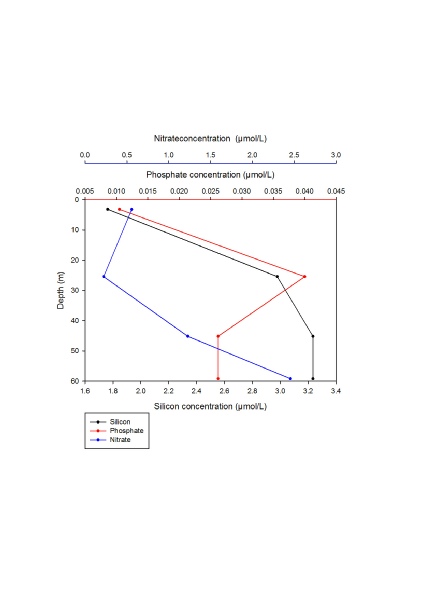
At station 64 (figure 1C) silicon concentration increased with depth with nitrate showing a minimum at 25m at 0.2 umol/L. However, nitrate is higher at the bottom than the surface. Phosphate has a recorded maximum at around 25m at 0.04 umol/L before decreasing and stabilising at 45m. The decrease in nitrate, again, suggests uptake by biota.
At station 66 (figure 1D) silicon and phosphate both peaked at 30m and vary little below this depth. Both generally increased with depth. Nitrate, likewise, increased with depth. The surface sample taken at this station was at 17 because the CTD data suggested that nothing of interest occurred between the surface and that depth. The general increase of all nutrients suggested that little uptake was occurring.
At station 67 (figure 1E) phosphate shows a maximum at 20m at 0.072 umol/L but overall, concentration increased between the surface and the bottom. Silicon appeared to increase uniformly with depth and nitrate showed a similar pattern.