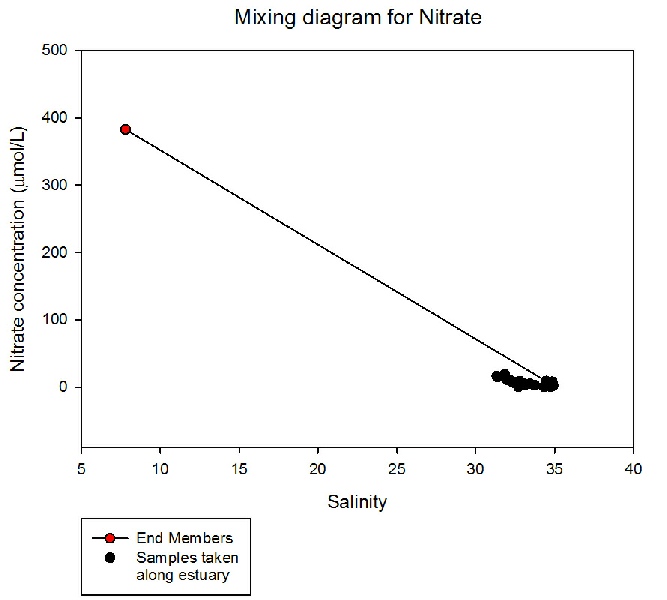
A) Nitrate Mixing Diagram
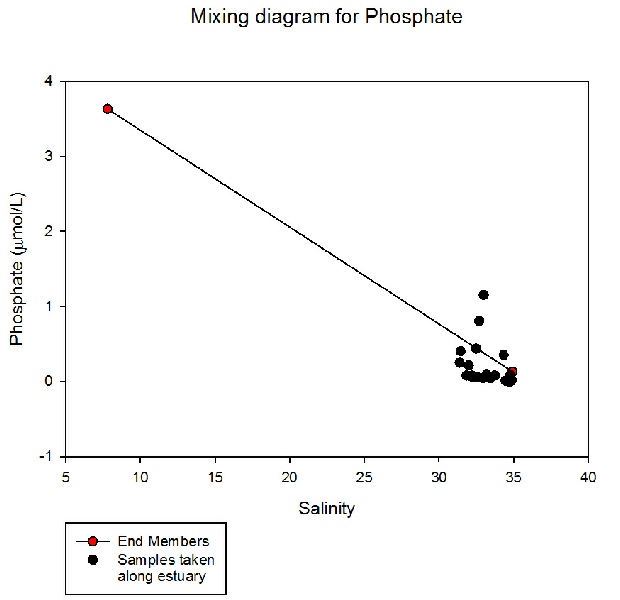
B) Phosphate Mixing Diagram
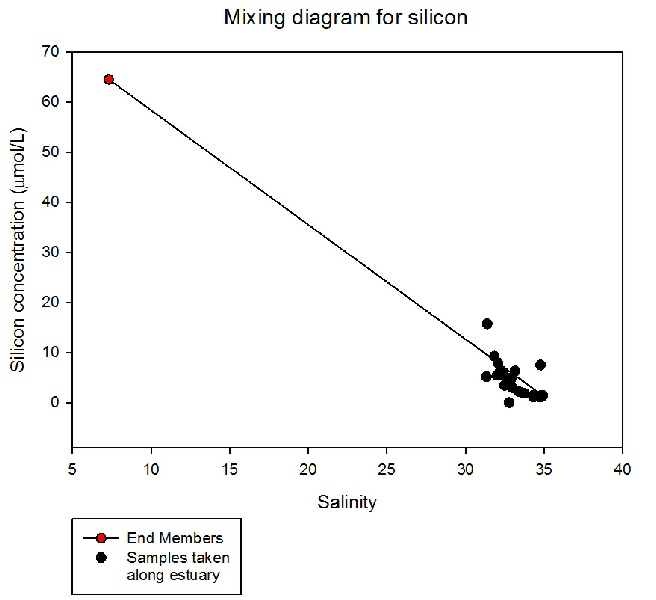
C) Silicon Mixing Diagram
Figure 7 A-
(Click individual graphs to enlarge).
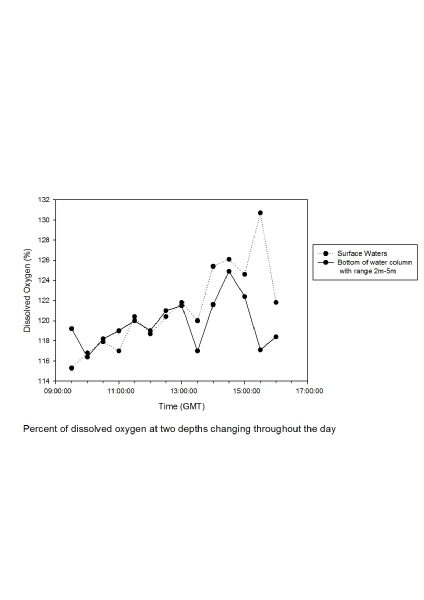
Figure 8 Shows oxygen saturation as a percentage with depth at each station along the transect of the Fal Estuary and subsequent river. Data taken on the 27/06/2014 between 07:20 and 12:22 UTC
(Click individual graphs to enlarge).
Figure 8 shows how the oxygen saturation was changing with depth at each station, however, due to a limited number of sampling bottles oxygen samples were not taken at all depths or at all stations. The graph shows that in general the oxygen saturation was decreasing with depth at all stations. This may be because the surface waters are equilibrating with the atmosphere and in the deeper water oxygen was being used as there was decomposition of dead organisms on the seabed.
Station 7 is an exception as between 0.9 to 4.1m the oxygen saturation increased from 101.8% to 105.2% before then decreasing to 91.6% between 4.1 and 13.9m. Finally, it then increased again between 13.9 and 19.3m from 91.6% to 107.3%. These changes may be due to the fact that the chlorophyll maximum is at 5.5m which is similar to the dissolved oxygen maximum at which is at 4.13. This is to be expected as the chlorophyll and oxygen maximum are usually at similar points within the water column.
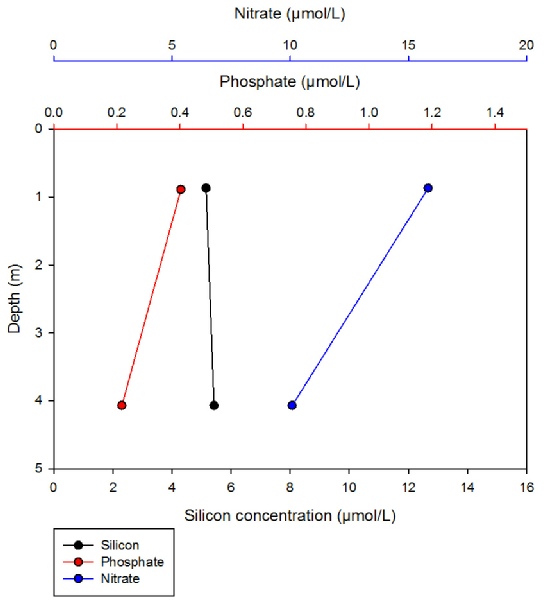
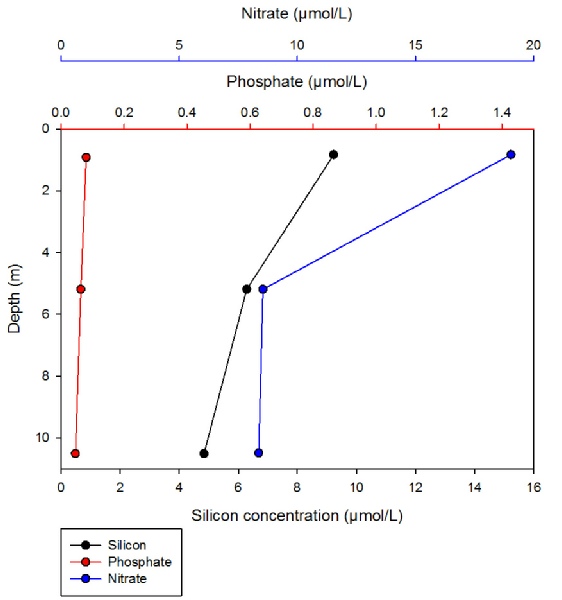
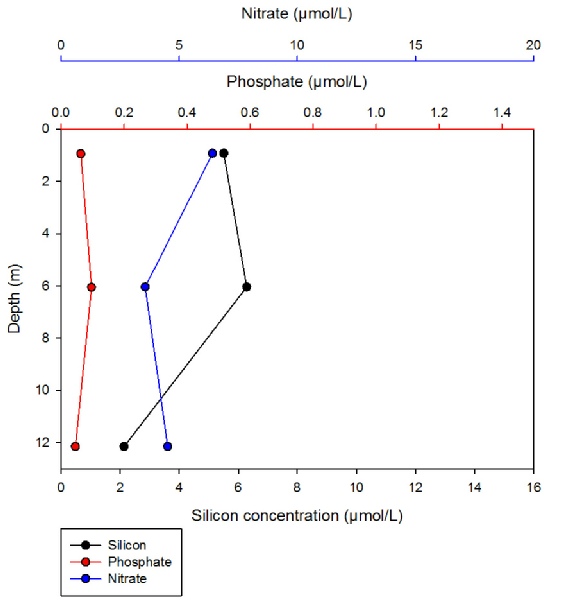
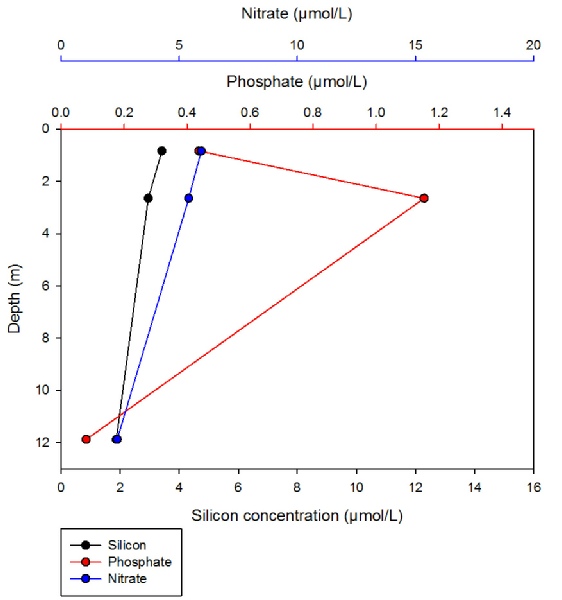
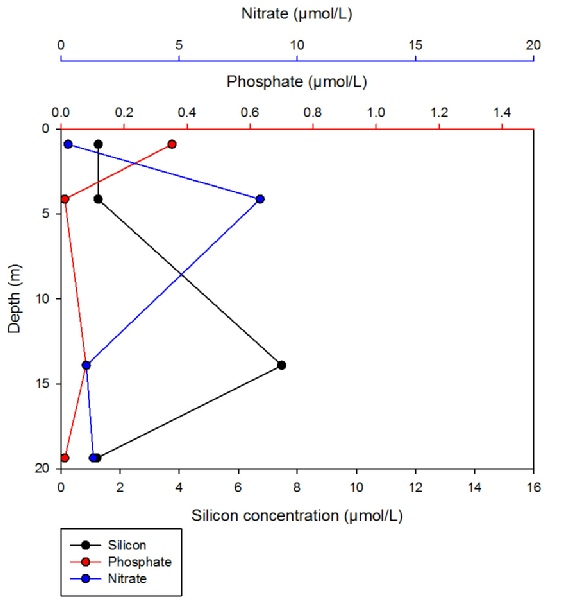
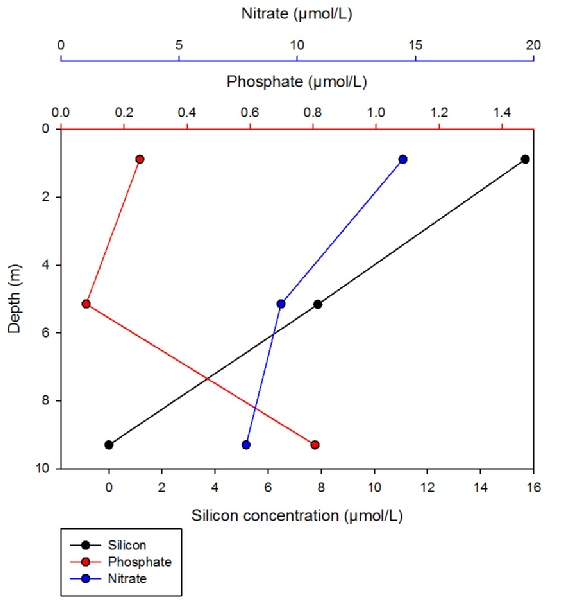
At Station 1 (figure 6A) phosphate and nitrate both decrease in concentration with depth, with nitrate showing the largest decrease. Silicon concentration remained fairly constant showing a slight increase with depth, however the increase was small. At station 2 (figure 6B) phosphate concentration was low at the surface (around 0.25μmol/L). It then decreased by about 1 μmol/L before increasing to 0.8 μmol/L at 9m depth. Nitrate shows a decrease of roughly 7 μmol/L with depth, with there being a sharp decrease between 1 and 5 metres before only decreasing a small amount between 5m and 9m. Silicon decreased at a constant rate from 16 μmol/L to 0 μmol/L. At station 3 (figure 6C) the phosphate concentration was low (~0.8 μmol/L). The concentration remained low throughout the water column, decreasing by ~0.5 μmol/L. Nitrate concentration at the surface was high (19 μmol/L), it then decreased rapidly between 1m and 5m dropping to 9 μmol/L concentration. Between 5m and 10m the concentration stayed constant. Silicon concentration decreased with depth, between 1m and 5m it decreased by roughly 3 μmol/L. Between 5m and 11m silicon concentration decreased by roughly 1 μmol/L. Figure 6D shows that at station 4 the phosphate concentration at this station was low (0.05 μmol/L) and remains low throughout the water column increasing very slightly at 6m depth. Nitrate concentration was highest at the surface (6 μmol/L). It then decreased from 1m to 6m before increasing slightly at 12m. Silicon concentration increased from 5.5 μmol/L to 6 μmol/L, before decreasing to 2 μmol/L at 12m.
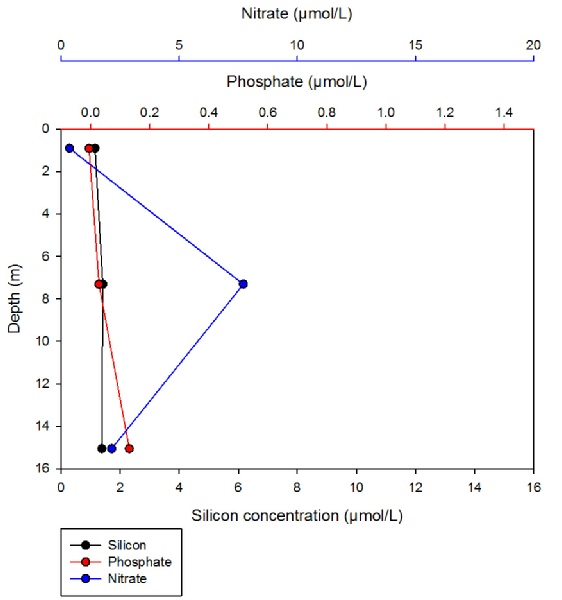
At station 5 (figure 6E) shows phosphate concentration shows a sharp increase between 1m and 3m, increasing by around 0.7 μmol/L. Between 3m and 12m there was a decrease of around 1μmol/L. Nitrate showed a steady decrease in concentration between 1m and 12m, decreasing by 2μmol/L. Silicon showed a similar trend to nitrate showing a steady decrease of 1μmol/L. At station 6 (figure 6F) phosphate concentration was higher at the surface (0.35 μmol/L), it then decreased to 0 μmol/L at 4m before increasing slightly again at 14m and then decreasing to 0 at 19m. Nitrate concentration was very low at the surface (0.03μmol/L). Between 1m and 5m there was an increase of 8 μmol/L. After 5m nitrate concentration decreased to 1 μmol/L. Silicon concentration was low in the first 5m of the water column (1 μmol/L). Between 5m and 14m it increased by 7 μmol/L before decreasing to 1 μmol/L again at 19m. In the first 7m at station 7 (figure 6G) there was very little phosphate, but after 7m there was a small increase of 0.1 μmol/L. There was no nitrate at the surface, however there was an increase of 7 μmol/L from 1m to 7m. After 7m it decreased to around 3 μmol/L. Silicon remained at a constant concentration of 1 μmol/L throughout the water column.
High salinities, between 30 and 35, were measured throughout the entirety of the estuary sampled and so the values for each nutrient vary little, however, a river end member was taken to be able to draw a mixing profile for each nutrient and therefore draw a theoretical dilution line (TDL).
Nitrate (figure 7A) shows a negative correlation with salinity and shows definite
non-
Phosphate (figure 7B), similarly to silicon, also shows a negative correlation with
salinity. Also similar to the mixing profile for silicon, most of the points bow
out below the TDL and so suggest non-
Dissolved silicon concentration (figure 7C), generally shows a negative correlation
with salinity, with concentration being highest at the lowest salinity and decreasing
with increasing salinity. The mixing profile suggests that silicon was behaving non-
In general the concentration of nutrients is higher at the river end of the estuary. This could suggest that the nutrients are being diluted through tidal mixing down the estuary.
Chemical Estuarine Results
G) Station 7
A) Station 1
B) Station 2
C) Station 3
D) Station 4
E) Station 5
F) Station 6
G) Station 7
Figure 9A-
(Click individual graphs to enlarge).
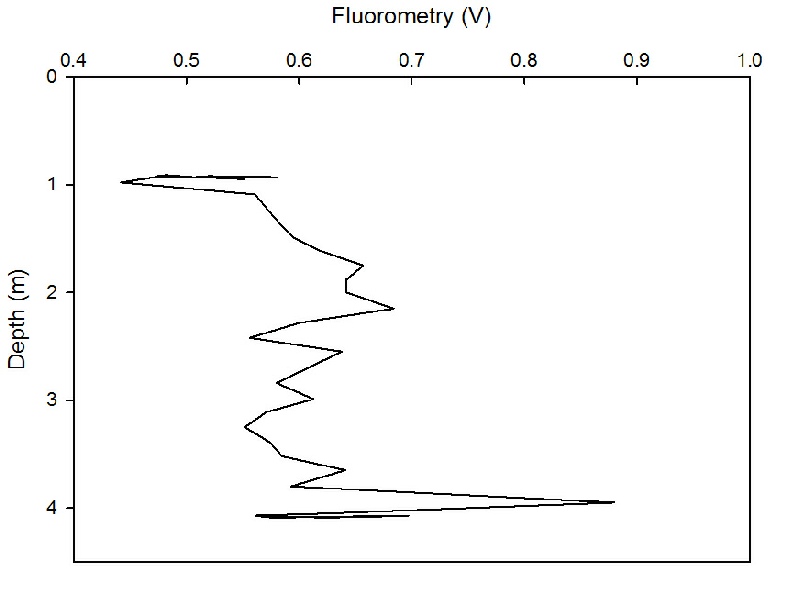
Figure 9A fshows that there was an overall increase in fluorometery with depth, ranging from roughly 0.6 V at 1m to roughly 0.9 V at 4m. There was an initial decrease in fluorometery followed by an increase and then there were fluctuations in the spread.
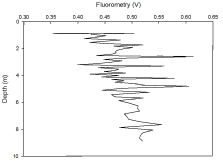
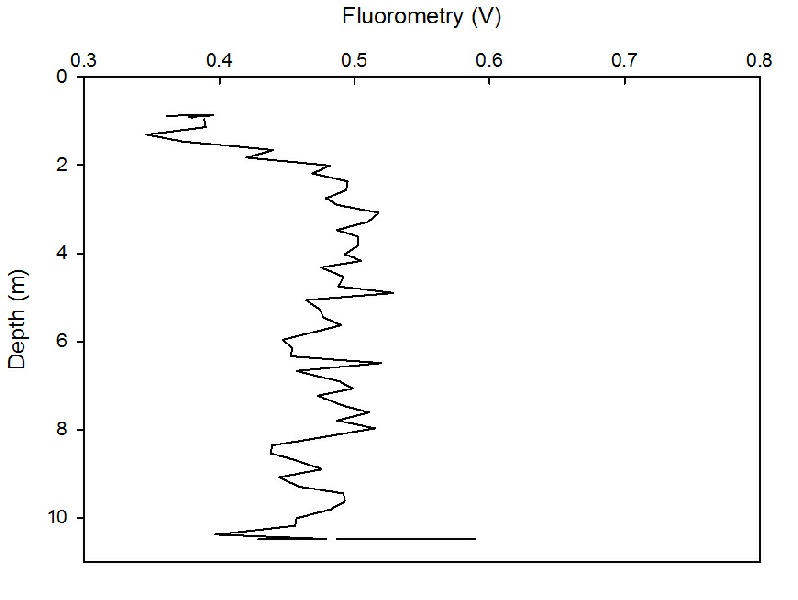
Figure 9B shows that there was an overall decrease in fluorometery with depth, with fluctuations in the increase and decrease of fluorometery with depth. The lowest fluorometery value was at 0.35 V at 1m and the highest value of roughly 0.53 V at 9m.
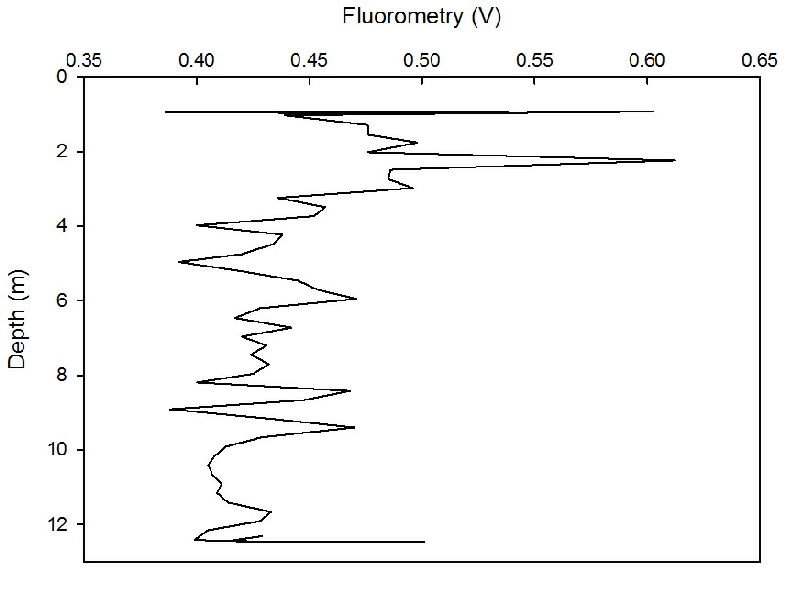
Figure 9C shows that there was an initial increase, followed by a gradual decrease in fluorometery, producing an overall increase with depth. The fluorometery values ranged from roughly 0.35 V at 1m to 0.6 V at roughly 10m.
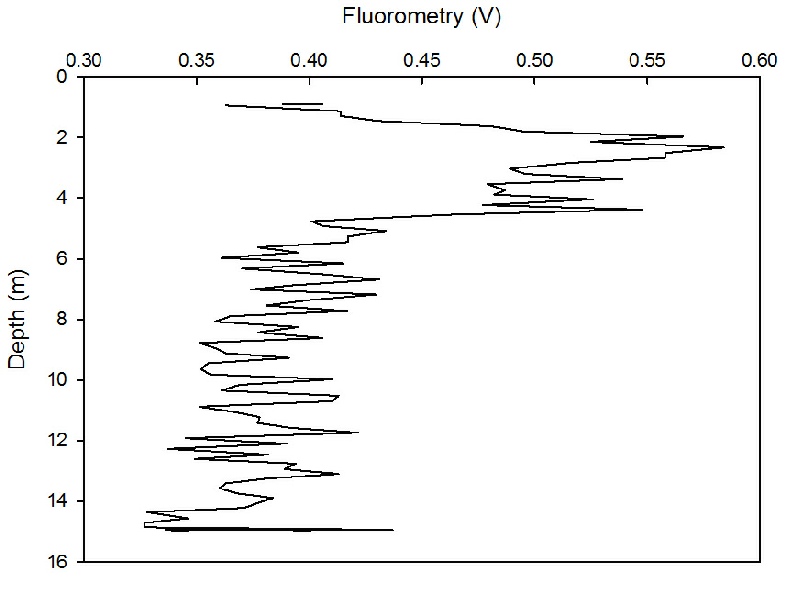
Figure 9D shows that the overall fluorometery decreased slightly with depth, with the greatest fluorometery value of over 0.60 V at 1m and the lowest value of roughly 0.38 at roughly 1m.
Figure 9E shows that there was an overall slight decrease in fluorometery with depth.
There was an initial rapid increase in fluorometery followed by a rapid decrease
until 5m and then a slower decrease in fluorometery between 5-
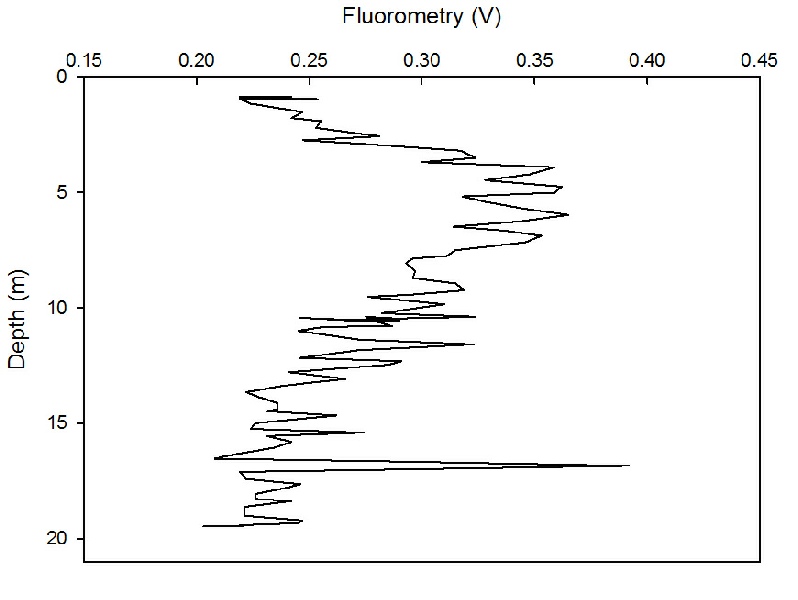
Figure 9F shows that there was a gradual increase in fluorometery with depth between
1m to 6m, followed by a gradual decrease between 7-
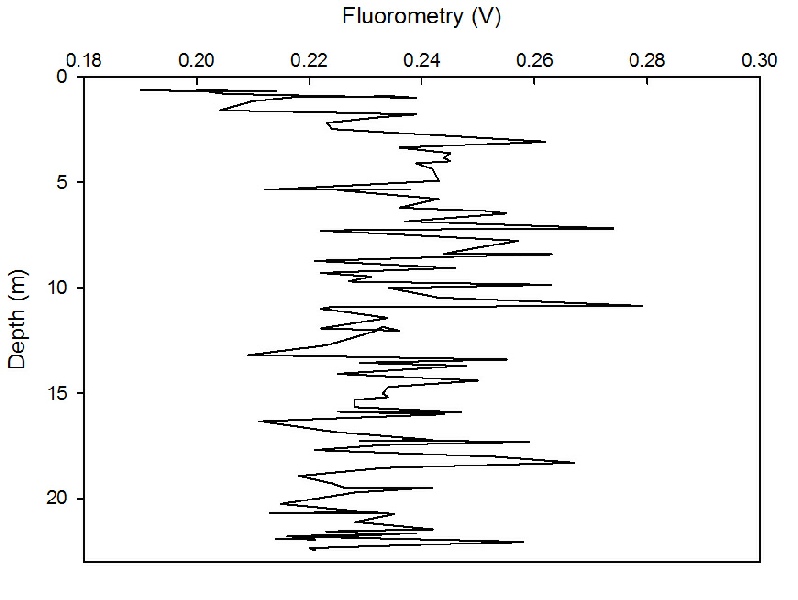
Figure 9G shows that there was an initial increase in fluorometery with depth from
0-
The profiles show that the chlorophyll was lower at the mouth end of the estuary, this could be because there were higher nutrients at the river end of the estuary (shown by figure 6).
A) Station 1
B) Station 2
C) Station 3
D) Station 4
E) Station 5
F) Station 6
Figures 6 A-
(Click individual graphs to enlarge).
Disclaimer -